Energizer 2008 Annual Report Download - page 14
Download and view the complete annual report
Please find page 14 of the 2008 Energizer annual report below. You can navigate through the pages in the report by either clicking on the pages listed below, or by using the keyword search tool below to find specific information within the annual report.-
 1
1 -
2
-
3
-
 4
4 -
 5
5 -
 6
6 -
 7
7 -
 8
8 -
 9
9 -
 10
10 -
 11
11 -
 12
12 -
 13
13 -
 14
14 -
 15
15 -
 16
16 -
 17
17 -
 18
18 -
 19
19 -
 20
20 -
 21
21 -
 22
22 -
 23
23 -
 24
24 -
25
-
26
-
27
-
28
-
29
-
30
-
31
-
32
-
33
-
34
-
35
-
36
-
37
-
38
-
39
-
40
-
41
-
42
-
43
-
44
-
45
-
46
-
47
-
48
 |
 |

12 ENERGIZER HOLDINGS, INC. 2008 Annual Report
Management’s Discussion and Analysis of Results of Operations and Financial Condition
(Dollars in millions, except per share and percentage data)
OPERATING RESULTS
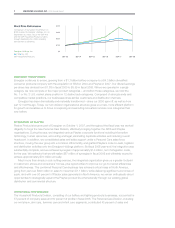
Net Sales Total net sales for fiscal 2008 were $4,331.0, an increase
of $965.9, or 29%, due primarily to the acquisition of Playtex, which
added $771.7 to net sales for the year. Net sales increased $98.0
in Household Products and $96.2 in SWS. On a constant currency
basis, net sales increased $811.0 as compared to 2007, again due to
the acquisition of Playtex. Net sales in 2007 increased $288.2, or 9%,
in absolute dollars and $212.7, or 7%, on a constant currency basis
compared to 2006.
Gross Profit Gross profit dollars were $2,037.7 in 2008, an increase
of $433.0, or 27% due primarily to the addition of Playtex, which
added $375.2 to gross profit. The 2008 increase includes favorable
currency of $121.6. In 2007, gross profit dollars increased $123.9 with
increases in both businesses.
Gross margin percentage was 47.0% of sales in 2008, 47.7% in 2007
and 48.1% in 2006. The margin percentage decline in 2008 is due
primarily to higher year over year product costs. The margin percent-
age decline in 2007 is due primarily to lower margin in our Household
Products segment, also driven by higher material costs. See Segment
Results for further discussion.
Selling, General and Administrative Selling, general and administra-
tive expenses (SG&A) were $794.0 for 2008, an increase of $166.1
due primarily to the acquisition of Playtex. As a percent of net sales,
SG&A was 18.3%, down 0.4 percentage points from the 2007 total.
SG&A increased $26.0 in 2007 due to currency impacts of $15.0
and higher spending in Household Products, partially offset by lower
restructuring charges as compared to 2006. As a percent of net sales,
SG&A was 18.7% for 2007 as compared to 19.6% in 2006.
Advertising and Promotion Advertising and promotion (A&P) increased
$91.6 in 2008 due to the acquisition of Playtex, which added $112.3 to
A&P for 2008. A&P increased $26.3 in 2007 with increased spending in
the Household Products segment and currency impacts of $9.6.
A&P expense was 11.2%, 11.7% and 12.0% of sales for 2008, 2007
and 2006, respectively. In addition to the impact that accompanies a
major acquisition, A&P expense may vary from year to year with new
product launches, strategic brand support initiatives and the overall
competitive environment.
Research and Development Research and development (R&D)
expense was $91.7 in 2008, $70.7 in 2007 and $74.2 in 2006. The
expense in 2008 includes $19.9 for Playtex, which represents the
majority of the increase. As a percent of sales, R&D expense was
2.1% in 2008 and 2007 and 2.4% in 2006.
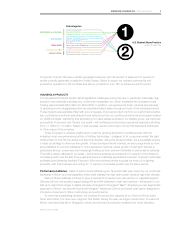
Segment Results In the first quarter of fiscal 2008, the Company
revised its operating segment presentation. Operations for the
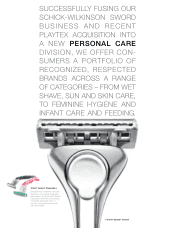
Company are managed via two segments - Household Products
(battery and lighting products) and Personal Care (wet shave, skin,
feminine and infant care). Segment performance is evaluated based
on segment operating profit, exclusive of general corporate expenses,
share-based compensation costs, costs associated with most
restructuring, integration or business realignment activities and amor-
tization of intangible assets. Financial items, such as interest income
and expense, are managed on a global basis at the corporate level.
This structure is the basis for the Company’s reportable operating
segment information presented in Note 18 to the Consolidated
Financial Statements.
The reduction in gross profit associated with the write-up and subse-
quent sale of the inventory acquired in the Playtex acquisition and the
acquisition integration costs for the Playtex acquisition are not reflected
in the Personal Care segment, but rather presented below segment
profit, as they are non-recurring items directly associated with the
Playtex acquisition. Such presentation reflects management’s view on
how it evaluates segment performance.
The Company’s operating model includes a combination of stand-
alone and combined business functions between Household Products
and Personal Care, varying by country and region of the world. Shared
functions include product warehousing and distribution, various trans-
action processing functions, and, in some countries, a combined sales
force and management. Such allocations do not represent the costs
of such services if performed on a stand-alone basis. The Company
applies a fully allocated cost basis, in which shared business functions
are allocated between the businesses.
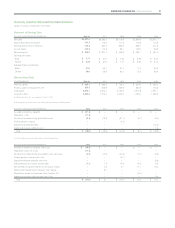
Household Products
2008 2007 2006
Net sales $2,474.3 $2,376.3 $2,147.1
Segment profit $ 489.1 $ 472.3 $ 442.3
For the year, sales increased $98.0, inclusive of $88.1 favorable cur-
rency translation. Absent currencies, sales increased $9.9, as favorable
pricing and product mix were partially offset by lower sales volume.
Soft overall category demand in most of the developed world was
nearly offset by sales to meet hurricane demand and early holiday sea-
son buy-in within the U.S. and volume growth in Central and Eastern
Europe and Latin America. Overall pricing and price mix was favorable
$15.8 as list price increases taken to offset rising material costs were
partially offset by sales shifting to larger pack sizes, which sell at lower
per unit prices.
Gross margin increased $40.2 for the year, but declined $34.7 absent
the favorable impact of currencies. The benefit of higher pricing was
more than offset by unfavorable product cost of $63.2, due primarily to
higher commodity material costs and unfavorable production volumes.
Segment profit increased $16.8 but declined $34.8 due to the lower
gross margin noted above after excluding favorable currency impacts.
Excluding currency impacts, higher SG&A expenses were nearly offset
by lower A&P spending.