Energizer 2003 Annual Report Download - page 46
Download and view the complete annual report
Please find page 46 of the 2003 Energizer annual report below. You can navigate through the pages in the report by either clicking on the pages listed below, or by using the keyword search tool below to find specific information within the annual report.-
 1
1 -
2
-
3
-
4
-
5
-
6
-
7
-
8
-
9
-
10
-
11
-
12
-
13
-
14
-
15
-
16
-
17
-
18
-
19
-
20
-
21
-
22
-
23
-
24
-
25
-
26
-
27
-
28
-
29
-
30
-
31
-
32
-
33
-
34
-
35
-
 36
36 -
 37
37 -
 38
38 -
 39
39 -
 40
40 -
 41
41 -
 42
42 -
 43
43 -
 44
44 -
 45
45 -
 46
46 -
 47
47 -
 48
48
 |
 |

Page 44 ENR 2003 ANNUAL REPORT
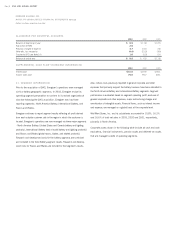
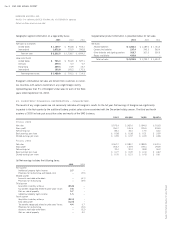
Geographic segment information on a legal entity basis:
2003 2002 2001
Net Sales to Customers
United States $ 1,159.7 $963.8 $ 903.4
International 1,072.8 775.9 790.8
Total net sales $ 2,232.5 $ 1,739.7 $ 1,694.2
Long-Lived Assets
United States $ 735.3 $518.9 $ 527.1
Germany 299.4 0.2 0.2
Hong Kong 259.3 15.9 16.7
International 195.0 165.2 170.3
Total long-lived assets $ 1,489.0 $700.2 $ 714.3
Energizer’s international net sales are derived from customers in numer-
ous countries, with sales to customers in any single foreign country
representing less than 5% of Energizer’s total sales for each of the three
years ended September 30, 2003.
Supplemental product information is presented below for net sales:
2003 2002 2001
Net Sales
Alkaline batteries $ 1,202.4 $ 1,189.0 $ 1,124.5
Carbon zinc batteries 237.4 243.2 263.4
Other batteries and lighting products 359.7 307.5 306.3
Razors and blades 433.0 ––
Total net sales $ 2,232.5 $ 1,739.7 $ 1,694.2
ENERGIZER HOLDINGS, INC.
NOTES TO CONSOLIDATED FINANCIAL STATEMENTS Continued
(Dollars in millions, except per share data)
Design: Falk Harrison Creative, St. Louis, Missouri
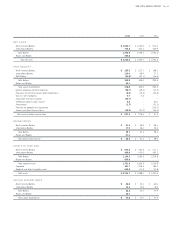
22. QUARTERLY FINANCIAL INFORMATION – (UNAUDITED)
The results of any single quarter are not necessarily indicative of Energizer’s results for the full year. Net earnings of Energizer are significantly
impacted in the first quarter by the additional battery product sales volume associated with the December holiday season. The third and fourth
quarters of 2003 include post acquisition sales and results of the SWS business.
FIRST SECOND THIRD FOURTH
FISCAL 2003
Net sales $ 572.4 $ 362.6 $ 594.0 $ 703.5
Gross profit 264.7 155.3 235.0 303.3
Net earnings (a) 86.4 33.0 17.5 33.0
Basic earnings per share $ 0.98 $ 0.38 $ 0.21 $ 0.39
Diluted earnings per share $ 0.95 $ 0.37 $ 0.20 $ 0.38
FISCAL 2002
Net sales $ 567.7 $ 339.7 $ 389.9 $ 442.4
Gross profit 262.7 149.9 169.4 193.9
Net earnings (a) 70.4 20.0 39.8 56.2
Basic earnings per share $ 0.77 $ 0.22 $ 0.44 $ 0.62
Diluted earnings per share $ 0.76 $ 0.21 $ 0.43 $ 0.61
(a) Net earnings includes the following items:
2003 2002
First quarter
Intellectual property rights income 3.7 –
Provisions for restructuring and related costs –(2.9)
Second quarter
Accounts receivable write-down –(6.1)
Provisions for restructuring –(2.9)
Third quarter
Acquisition inventory write-up (35.9) –
Tax benefits recognized related to prior years’ losses 7.8 –
Gain on sale of property 5.7 –
Intellectual property rights income 1.5 –
Fourth quarter
Acquisition inventory write-up (22.4) –
Early debt payoff (12.4) –
Tax benefits recognized related to prior years’ losses 4.4 6.7
Provisions for restructuring –(2.0)
Accounts receivable write-down –(3.2)
Gain on sale of property –5.0