Energizer 2003 Annual Report Download - page 13
Download and view the complete annual report
Please find page 13 of the 2003 Energizer annual report below. You can navigate through the pages in the report by either clicking on the pages listed below, or by using the keyword search tool below to find specific information within the annual report.-
 1
1 -
2
-
 3
3 -
 4
4 -
 5
5 -
 6
6 -
 7
7 -
 8
8 -
 9
9 -
 10
10 -
 11
11 -
 12
12 -
 13
13 -
 14
14 -
 15
15 -
 16
16 -
 17
17 -
 18
18 -
 19
19 -
 20
20 -
 21
21 -
 22
22 -
 23
23 -
24
-
25
-
26
-
27
-
28
-
29
-
30
-
31
-
32
-
33
-
34
-
35
-
36
-
37
-
38
-
39
-
40
-
41
-
42
-
43
-
44
-
45
-
46
-
47
-
48
 |
 |
ENR 2003 ANNUAL REPORT Page 11
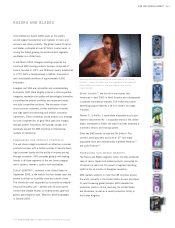
and willingness to regularly purchase the products, as well as competi-
tive offerings.
HIGHLIGHTS
Net earnings for the year ended September 30, 2003 were $169.9 com-
pared to $186.4 in 2002 and a net loss of $39.0 in 2001. Basic and
diluted earnings per share in 2003 were $1.98 and $1.93, respectively,
compared to $2.05 and $2.01 and a loss of $.42 per share in 2001.
Current year net earnings include the following items, stated on an after-
tax basis: expense associated with the write-up of inventory purchased in
the SWS acquisition (SWS inventory write-up) of $58.3, a charge for early
payment of long-term debt of $12.4, gain on the sale of property of $5.7,
intellectual property rights income of $5.2 and tax benefits of $12.2
related to improved earnings in countries with tax losses in prior years.
Fiscal 2002 net earnings included the following after-tax items: accounts
receivable write-off associated with the bankruptcy of Kmart of $9.3,
provisions for restructuring and related costs of $7.8, tax benefits related
to prior years’ losses of $6.7 and a gain on the sale of property of $5.0.
Fiscal 2001 results included the following after-tax items: a provision for
goodwill impairment of $119.0, restructuring charges and related costs of
$19.4 and amortization of goodwill and other intangible assets of $15.1,
which is no longer required under accounting rules adopted in fiscal
2002, as well as intellectual property rights income of $12.3.
OPERATING RESULTS
Net Sales
Net sales increased $492.8, or 28%, in 2003 compared to 2002
reflecting incremental sales from the SWS acquisition of $433.0 as well
as increases in International and North America battery sales. Net sales
increased $45.5, or 3%, in 2002 versus 2001 on higher volume.
Favorable pricing and product mix was substantially offset by currency
devaluation. See comments on sales by segment in the Segment Results
section below.
Gross Margin
Gross margin dollars increased $182.4, or 24%, in 2003 primarily
due to the SWS acquisition. Gross margin percentage was 42.9% of
sales in 2003 which includes a 4 percentage point reduction due to
expense related to the SWS inventory write-up. Absent the SWS
inventory write-up, gross margin would have been 46.9% for 2003
compared to 44.6% in 2002, primarily due to the inclusion of SWS
higher margin sales. Gross margin dollars increased $80.8, or 12%,
in 2002 on lower product costs and higher sales. Gross margin per-
centage improved 3.6 percentage points in 2002 to 44.6% of sales.
All segments benefited in 2002 from lower material and variable costs,
the impact of restructuring activities undertaken in 2001 and improved
plant operating levels.
Selling, General and Administrative
Selling, general and administrative expense increased $75.6 due to the
inclusion of SWS for the second half of 2003 and higher corporate
expenses, partially offset by the absence of a $15.0 write-off of Kmart
pre-bankruptcy accounts receivable recorded in 2002. Selling, general and
administrative expense decreased $13.3, or 4%, in 2002 on lower over-
head costs in the North America and International Battery segments and the
absence of goodwill and intangible amortization, which was no longer
amortized as of 2002 due to the adoption of new accounting rules, partially
offset by higher corporate expenses and the $15.0 write-off of Kmart
accounts receivable. Selling, general and administrative expenses were
17.1%, 17.6% and 18.9% of sales in 2003, 2002 and 2001, respectively.
Advertising and Promotion
Advertising and promotion expense increased $126.5 in 2003 com-
pared to 2002 due to the inclusion of SWS with significant spending for
new product launches, as well as increases in the International Battery
segment. Advertising and promotion expense decreased $9.1 in 2002
on lower spending in both battery segments. Advertising and promotion
as a percent of sales was 11.2%, 7.2% and 7.9% in 2003, 2002 and
2001, respectively. The increase in the 2003 rate is primarily due to
significantly higher percentage spending in the Razors and Blades seg-
ment. Inclusion of SWS results for a full year in 2003 would have
resulted in advertising and promotion expense of 12.1% of sales.
Research and Development
Research and development expense was $51.5 in 2003, $37.1 in
2002 and $46.4 in 2001. The increase in 2003 reflects $15.5 incre-
mental expense due to the SWS acquisition. In 2002, Energizer focused
its battery research on new and improved products for retail applications
and reduced spending on products designed for industrial applications.
As a percent of sales, research and development expense was 2.3% in
2003, 2.1% in 2002 and 2.7% in 2001. Inclusion of SWS results for a
full year in 2003 would have resulted in research and development
expense of 2.6% of sales.
SEGMENT RESULTS
Prior to the acquisition of SWS, Energizer’s operations were managed
via four battery geographic segments. Beginning in 2003, Energizer
revised its operating segment presentation to conform to its revised
organizational structure following the acquisition. Energizer continues to
report segment results reflecting all profit derived from each outside
customer sale in the region in which the customer is located. Energizer’s