Energizer 2003 Annual Report Download - page 17
Download and view the complete annual report
Please find page 17 of the 2003 Energizer annual report below. You can navigate through the pages in the report by either clicking on the pages listed below, or by using the keyword search tool below to find specific information within the annual report.-
 1
1 -
2
-
3
-
4
-
5
-
6
-
 7
7 -
 8
8 -
 9
9 -
 10
10 -
 11
11 -
 12
12 -
 13
13 -
 14
14 -
 15
15 -
 16
16 -
 17
17 -
 18
18 -
 19
19 -
 20
20 -
 21
21 -
 22
22 -
 23
23 -
 24
24 -
 25
25 -
 26
26 -
 27
27 -
28
-
29
-
30
-
31
-
32
-
33
-
34
-
35
-
36
-
37
-
38
-
39
-
40
-
41
-
42
-
43
-
44
-
45
-
46
-
47
-
48
 |
 |

be in the 33-35% range. Shifts of earnings from lower to higher tax
rate countries or higher losses in countries where tax benefits cannot
be recognized could increase future tax rates. Conversely, favorable
country earnings mix, improving profits in previous loss countries or
reduced foreign losses could reduce future tax rates. Additionally, future
tax rates may reflect benefit of reversal of deferred tax valuation
allowances if favorable foreign earnings trends are sustained.
LIQUIDITY AND CAPITAL RESOURCES
Cash flow from operations totaled $442.1 in 2003, an increase of
$236.0 from 2002 operating cash flows of $206.1. The increase
is due to cash generated from working capital changes of $201.9
compared to cash outflows for working capital in 2002 of $53.7,
partially offset by lower cash flow from earnings before working
capital changes. The most significant working capital changes were:
1) a $148.0 reduction in inventory, reflecting the conversion of high
cost acquired SWS inventory to lower cost SWS inventory manufac-
tured after acquisition as well as other inventory reductions; and 2)
a $136.2 cash flow improvement in other current assets, primarily
related to the level of sales of accounts receivable by Energizer's
non-consolidated SPE; partially offset by 3) unfavorable cash flow
from increases in accounts receivable in 2003. Cash flow from
operations before changes in working capital were $240.2 in 2003
compared to $259.8 in 2002. The decrease was mainly due to
lower net earnings caused by the $58.3 after-tax SWS inventory
write-up discussed previously, partially offset by higher earnings for
the remainder of the business.
Cash flow from operations of $206.1 in 2002 decreased $112.0,
compared to 2001. Cash outflows related to working capital were
$53.7 in 2002 compared to net cash generated from working capital of
$127.9 in 2001, creating a $181.6 unfavorable cash flow comparison
related to working capital changes. The most significant working capital
changes were: 1) an unfavorable cash flow comparison of $156.3,
primarily related to the level of sales of accounts receivable by
Energizer's non-consolidated SPE; 2) a $90.2 reduction in inventory
in 2001 with a minimal corresponding decrease in 2002; partially
offset by 3) improved cash flows related to other working capital items.
Unfavorable cash flow from working capital changes were partially
offset by higher operating cash flow before changes in working capital.
Working capital was $515.6 and $353.3 at September 30, 2003
and 2002, respectively, reflecting the addition of the SWS business.
Capital expenditures totaled $73.0, $40.7 and $77.9 in 2003, 2002
and 2001, respectively. These expenditures were funded by cash flow
from operations. Capital expenditures increased in 2003 as a result of
the acquisition of SWS. Capital expenditures decreased in 2002 as
several major projects were completed in late 2001 and early 2002.
Capital expenditures of approximately $115.0 are anticipated in
2004, as Energizer will reflect a full year of SWS operations and
planned battery expenditures are anticipated to increase modestly.
Such expenditures are expected to be financed with funds generated
from operations.
Total long-term debt outstanding, including current maturities was
$933.6 at September 30, 2003. Energizer maintains total committed
debt facilities of $1,258.3, of which $319.2 remained available as
of September 30, 2003.
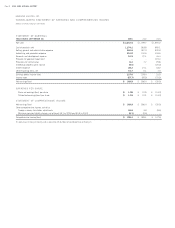
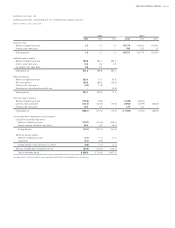
A summary of Energizer’s significant contractual obligations at
September 30, 2003 is shown below. See Note 19 to the Consolidated
Financial Statements for discussion of letters of credit, loan guarantees
and guarantees for the purchase of goods used in production.
MORE
LESS THAN 1-3 3-5 THAN 5
TOTAL 1 YEAR YEARS YEARS YEARS
Long-term debt,
including current
maturities $ 933.6 $ 20.0 $ 168.6 $ 155.0 $ 590.0
Notes payable 66.1 66.1 – – –
Operating leases 97.3 14.5 22.4 15.1 45.3
Total $ 1,097.0 $ 100.6 $ 191.0 $ 170.1 $ 635.3
Under the terms of Energizer’s debt facilities, the ratio of Energizer’s
total indebtedness to its Earnings Before Interest, Taxes, Depreciation
and Amortization (EBITDA) (as defined by the facility agreement and
pro forma in the current year) cannot be greater than 3.5 to 1, and the
ratio of its current year pro forma EBIT to total interest expense must
exceed 3.5 to 1. Energizer’s ratio of total indebtedness to its pro forma
EBITDA was 2.3 to 1, and the ratio of its pro forma EBIT to total
interest expense was 8.2 to 1 as of September 30, 2003. Additional
restrictive covenants exist under current debt facilities. Failure to comply
with the above ratios or other covenants could result in acceleration
of maturity, which could trigger cross defaults on other borrowings.
Energizer believes that covenant violations resulting in acceleration of
maturity is unlikely. Energizer’s fixed rate debt is callable by the compa-
ny, subject to a “make whole” premium, which would be required to
the extent the underlying benchmark United States treasury yield has
declined since issuance.
ENR 2003 ANNUAL REPORT Page 15