Energizer 2002 Annual Report Download - page 44
Download and view the complete annual report
Please find page 44 of the 2002 Energizer annual report below. You can navigate through the pages in the report by either clicking on the pages listed below, or by using the keyword search tool below to find specific information within the annual report.-
 1
1 -
2
-
3
-
4
-
5
-
6
-
7
-
8
-
9
-
10
-
11
-
12
-
13
-
14
-
15
-
16
-
17
-
18
-
19
-
20
-
21
-
22
-
23
-
24
-
25
-
26
-
27
-
28
-
29
-
30
-
31
-
32
-
33
-
 34
34 -
 35
35 -
 36
36 -
 37
37 -
 38
38 -
 39
39 -
 40
40 -
 41
41 -
 42
42 -
 43
43 -
 44
44 -
 45
45 -
 46
46 -
 47
47
 |
 |

ENR 2002 Annual Report Page 42
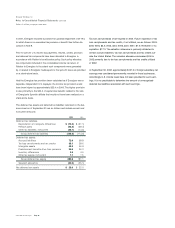
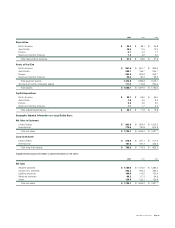
2002 2001 2000
Allowance for Doubtful Accounts:
Balance at beginning of year $ 11.8 $ 12.5 $ 19.3
Provision charged to expense 16.6 2.8 5.1
Write-offs, less recoveries (21.2) (3.9) (5.9)
Transfer to SPE (see Note 15) (0.3) 0.4 (6.0)
Balance at end of year $ 6.9 $ 11.8 $ 12.5
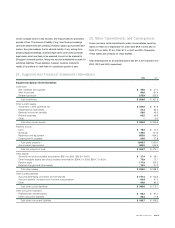
Supplemental Cash Flow Statement Information:
Interest paid $ 19.9 $ 36.1 $ 19.5
Income taxes paid 95.7 83.1 86.5
Energizer Holdings, Inc.
Notes to Consolidated Financial Statements Continued
(Dollars in millions, except per share data)
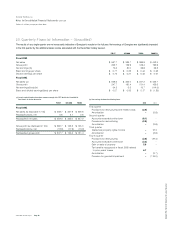
22. Segment Information
Energizer manufactures and markets dry cell batteries including alkaline, car-
bon zinc, miniature and specialty batteries, and flashlights and other lighting
products throughout the world. Operations are managed via four major geo-
graphic areas – North America (the United States, Canada and Caribbean),
Asia Pacific, Europe, and South and Central America (including Mexico). In
the past, each segment has reported profit from its intersegment sales in its
own segment results. Changes in intersegment profit captured in inventory
and not yet sold to outside customers were recorded in general corporate
expenses. Due to increased levels of intersegment sales related to production
consolidation and in light of Energizer’s current management objectives and
structure, Energizer believes the exclusion of intersegment profit in segment
results is a more appropriate view of its operating segments.
Beginning in fiscal 2002, Energizer reported segment results reflecting all
profit derived from each outside customer sale in the region in which the
customer is located. Profit on sales to other segments will no longer be
reported in the selling region. As a result, segments with manufacturing
capacity that are net exporters to other segments will show lower segment
profit than in the past. Segments that are net importers of Energizer manu-
factured product will show higher segment profit than in the past. Prior
periods have been restated for comparability.
Wal-Mart Stores, Inc. and its subsidiaries accounted for 16.3%, 16.6% and
15.3% of total net sales in 2002, 2001 and 2000, respectively, primarily in
North America.
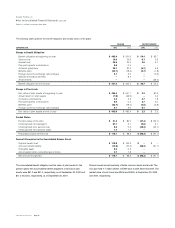
2002 2001 2000
Net Sales
North America $ 1,035.0 $ 970.3 $ 1,123.0
Asia Pacific 321.0 322.9 388.2
Europe 281.7 265.7 285.1
South and Central America 102.0 135.3 131.4
Total net sales $ 1,739.7 $ 1,694.2 $ 1,927.7
Operating Profit before Restructuring Charges, Amortization, Interest and Unusual Items
North America $ 286.2 $ 202.4 $ 309.2
Asia Pacific 78.5 66.6 95.2
Europe 21.3 6.6 10.1
South and Central America 9.7 13.3 18.9
Total segment profitability 395.7 288.9 433.4
General corporate and other expenses (55.0) (26.5) (35.1)
Research and development expense (37.1) (46.4) (49.9)
Operating profit before restructuring charges, amortization, interest and unusual items 303.6 216.0 348.4
Provisions for restructuring and other related costs (10.3) (29.8) –
Gain on sale of property 6.3 – –
Provision for goodwill impairment –(119.0) –
Intellectual property rights income –20.0 –
Costs related to spin-off –– (5.5)
Loss on disposition of Spanish affiliate –– (15.7)
Amortization –(21.2) (24.1)
Interest and other financial items (21.2) (34.5) (23.9)
Total earnings from continuing operations before income taxes $ 278.4 $ 31.5 $ 279.2