Energizer 2002 Annual Report Download - page 35
Download and view the complete annual report
Please find page 35 of the 2002 Energizer annual report below. You can navigate through the pages in the report by either clicking on the pages listed below, or by using the keyword search tool below to find specific information within the annual report.-
 1
1 -
2
-
3
-
4
-
5
-
6
-
7
-
8
-
9
-
10
-
11
-
12
-
13
-
14
-
15
-
16
-
17
-
18
-
19
-
20
-
21
-
22
-
23
-
24
-
 25
25 -
 26
26 -
 27
27 -
 28
28 -
 29
29 -
 30
30 -
 31
31 -
 32
32 -
 33
33 -
 34
34 -
 35
35 -
 36
36 -
 37
37 -
 38
38 -
 39
39 -
 40
40 -
 41
41 -
 42
42 -
 43
43 -
 44
44 -
 45
45 -
46
-
47
 |
 |

ENR 2002 Annual Report Page 33
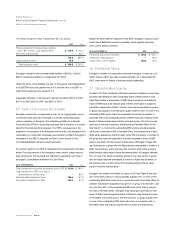
10. Earnings Per Share
For fiscal 2002 and 2001, basic earnings per share is based on the aver-
age number of shares outstanding during the period. Diluted earnings per
share is based on the average number of shares used for the basic earn-
ings per share calculation, adjusted for the dilutive effect of stock options
and restricted stock equivalents. In fiscal 2001, the potentially dilutive
securities were not included in the dilutive earnings per share calculation
due to their anti-dilutive effect.
Earnings per share has been calculated using Energizer’s historical
basis earnings for fiscal 2000. For the year ended September 30, 2000,
the number of shares used to compute basic earnings per share is
based on the weighted-average number of shares of Ralston stock
outstanding during the six months ended March 31, 2000 (adjusted for
the distribution of one share of Energizer stock for each three shares of
Ralston stock) and the weighted-average number of shares of Energizer
stock outstanding from April 1, 2000 to September 30, 2000.
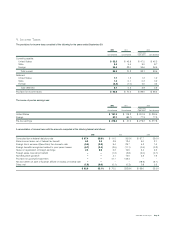
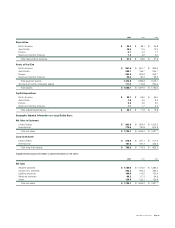
The following table sets forth the computation of basic and diluted earnings per share:
FOR THE YEAR ENDED SEPTEMBER 30, 2002 2001 2000
Numerator
Numerator for basic and dilutive earnings per share –
Earnings/(loss) from continuing operations $ 186.4 $ (39.0) $ 180.2
Net gain on disposition of discontinued operations –– 1.2
Net earnings/(loss) $ 186.4 $ (39.0) $ 181.4
Denominator
Denominator for basic earnings per share –
Weighted-average shares 91.0 92.6 96.1
Effect of dilutive securities
Stock options 1.2 1.0 0.1
Restricted stock equivalents 0.6 0.5 0.1
Total dilutive securities 1.8 1.5 0.2
Denominator for dilutive earnings per share –
Weighted-average shares and assumed conversions 92.8 94.1 96.3
Basic earnings per share
Earnings/(loss) from continuing operations $ 2.05 $ (0.42) $ 1.88
Net gain on disposition of discontinued operations –– 0.01
Net earnings/(loss) $ 2.05 $ (0.42) $ 1.89
Diluted earnings per share
Earnings/(loss) from continuing operations $ 2.01 $ (0.42) $ 1.87
Net gain on disposition of discontinued operations –– 0.01
Net earnings/(loss) $ 2.01 $ (0.42) $ 1.88