Energizer 2002 Annual Report Download - page 32
Download and view the complete annual report
Please find page 32 of the 2002 Energizer annual report below. You can navigate through the pages in the report by either clicking on the pages listed below, or by using the keyword search tool below to find specific information within the annual report.-
 1
1 -
2
-
3
-
4
-
5
-
6
-
7
-
8
-
9
-
10
-
11
-
12
-
13
-
14
-
15
-
16
-
17
-
18
-
19
-
20
-
21
-
 22
22 -
 23
23 -
 24
24 -
 25
25 -
 26
26 -
 27
27 -
 28
28 -
 29
29 -
 30
30 -
 31
31 -
 32
32 -
 33
33 -
 34
34 -
 35
35 -
 36
36 -
 37
37 -
 38
38 -
 39
39 -
 40
40 -
 41
41 -
 42
42 -
43
-
44
-
45
-
46
-
47
 |
 |

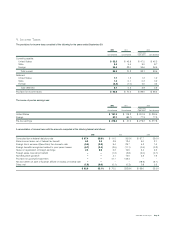
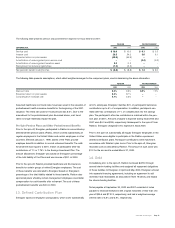
As required by SFAS 142, the results for periods prior to fiscal 2002
were not restated in the accompanying Consolidated Statement of
Earnings. A reconciliation between net earnings and earnings per
share reported by Energizer and net earnings and earnings per share
as adjusted to reflect the impact of SFAS 142 is provided below:
Energizer Holdings, Inc.
Notes to Consolidated Financial Statements Continued
(Dollars in millions, except per share data)
ENR 2002 Annual Report Page 30
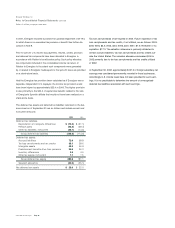
The following table represents the carrying amount of goodwill and trademarks by segment at September 30, 2002:
North South & Central
America Asia Europe America Total
Goodwill $ 24.7 $ 0.9 $ 9.1 $ 2.7 $ 37.4
Trademarks – Gross 413.8 24.3 – – 438.1
Trademarks – Accum. amortization (354.4) (9.8) – – (364.2)
Trademarks – Net carrying amount $ 59.4 $ 14.5 $ – $ – $ 73.9
YEAR ENDED SEPTEMBER 30, 2001 2000
Net earnings/(loss):
As reported $ (39.0) $ 181.4
Goodwill amortization, net of tax 12.1 13.6
Intangible asset amortization, net of tax 3.0 3.0
Adjusted net earnings/(loss) $ (23.9) $ 198.0
Basic earnings/(loss) per share:
As reported $ (0.42) $ 1.89
Goodwill amortization, net of tax 0.13 0.14
Intangible asset amortization, net of tax 0.03 0.03
Adjusted basic earnings/(loss) per share $ (0.26) $ 2.06
Diluted earnings/(loss) per share (a):
As reported $ (0.42) $ 1.88
Goodwill amortization, net of tax 0.13 0.14
Intangible asset amortization, net of tax 0.03 0.03
Adjusted diluted earnings/(loss) per share $ (0.26) $ 2.05
Basic shares 92.6 96.1
Diluted shares 94.1 96.3
(a) For fiscal year 2001, the potentially dilutive securities were not included in the dilutive earnings
per share calculation due to their anti-dilutive effect.