EasyJet 2013 Annual Report Download - page 90
Download and view the complete annual report
Please find page 90 of the 2013 EasyJet annual report below. You can navigate through the pages in the report by either clicking on the pages listed below, or by using the keyword search tool below to find specific information within the annual report.-
 1
1 -
2
-
3
-
4
-
5
-
6
-
7
-
8
-
9
-
10
-
11
-
12
-
13
-
14
-
15
-
16
-
17
-
18
-
19
-
20
-
21
-
22
-
23
-
24
-
25
-
26
-
27
-
28
-
29
-
30
-
31
-
32
-
33
-
34
-
35
-
36
-
37
-
38
-
39
-
40
-
41
-
42
-
43
-
44
-
45
-
46
-
47
-
48
-
49
-
50
-
51
-
52
-
53
-
54
-
55
-
56
-
57
-
58
-
59
-
60
-
61
-
62
-
63
-
64
-
65
-
66
-
67
-
68
-
69
-
70
-
71
-
72
-
73
-
74
-
75
-
76
-
77
-
78
-
79
-
 80
80 -
 81
81 -
 82
82 -
 83
83 -
 84
84 -
 85
85 -
 86
86 -
 87
87 -
 88
88 -
 89
89 -
 90
90 -
 91
91 -
 92
92 -
 93
93 -
 94
94 -
 95
95 -
 96
96 -
 97
97 -
 98
98 -
 99
99 -
 100
100 -
101
-
102
-
103
-
104
-
105
-
106
-
107
-
108
-
109
-
110
-
111
-
112
-
113
-
114
-
115
-
116
-
117
-
118
-
119
-
120
-
121
-
122
-
123
-
124
-
125
-
126
-
127
-
128
-
129
-
130
-
131
-
132
-
133
-
134
-
135
-
136
 |
 |

easyJet plc Annual report and accounts 2013
88
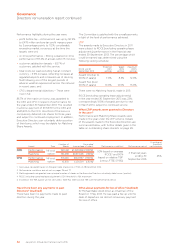
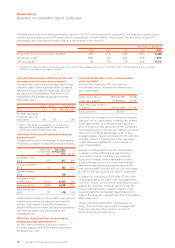
How does the change in CEO pay for the year
compare to that for easyJet employees?
The table below shows the percentage year-on-year
change in salary, benefits and annual bonus earned
between the year ended 30 September 2013 and
the year ended 30 September 2012 for the CEO
compared to the average UK easyJet employee
during each year.
% Salary Benefits Annual Bonus
CEO 0% 0% 10% reduction
Average pay based
on all easyJet’s UK
employees13% 3% 3%
1 Reflects the change in average pay for UK employees
employed in both the year ended 30 September 2012
and the year ended 30 September 2013.
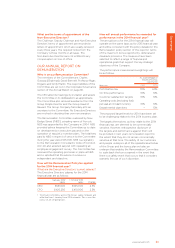
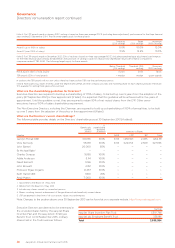
How much does easyJet spend on employee
pay each year?
The table below shows the total pay for all of easyJet’s
employees compared to other key financial indicators.
Year ended
30 September
2012
Year ended
30 September
2013
%
change
Employee costs
(£m) 476 517 8%
Ordinary dividend
(£m) 85 133 56%
Special dividend
(£m) – 175 –
Average number
of employees 8,206 8,343 2%
Revenues (£m) 3,854 4,258 10%
Profit before tax
(£m) 317 478 51%
Additional information on the number of employees,
total revenues and profit has been provided for
context. The majority of easyJet’s employees
(around 85%) perform flight and ground operations,
with the rest performing administrative and
managerial roles.
What have Executive Directors earned for
holding external appointments?
No fees were received by Executive Directors
for external appointments during the year ended
30 September 2013.
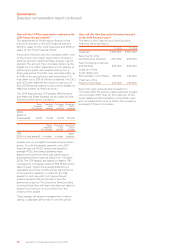
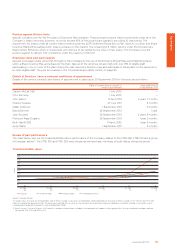
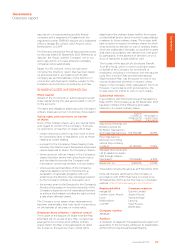
How did shareholders vote on remuneration
at the last AGM?
At the AGM in February 2013, the Directors’
remuneration report received the following votes
from shareholders:
Votes cast in favour 183,047,385 55.3%
Votes cast against 147,995,583 44.7%
Total votes cast in favour
or against 331,042,968 100.0%
Votes withheld 487,819
In line with the Company’s commitment to ongoing
dialogue with its shareholders, meetings are offered,
where appropriate, to understand the reasons for
any potential or actual opposition to the Company’s
remuneration policy. Changes are made to our policy
where it is considered appropriate to do so (e.g.
operating leases were incorporated into the definition
of ROCE used for LTIP purposes in the year under
review following feedback from the Company’s
major shareholders).
easyJet consulted extensively with shareholders
in advance of the 2013 financial year Directors’
remuneration report. In addition, we improved
disclosure to enable other shareholders to take
a fully informed view on the current remuneration
framework policies and practices at easyJet. We
met with the NAPF and the ABI, who recommended
a vote for and gave a “blue top” report respectively.
In relation to voting at our 2013 AGM, 37.3% of the
total shares able to be voted were cast against the
resolution. Two of our top twenty shareholders voted
against the resolution. However, all of our top 20
institutional shareholders voted in support of the
resolution and the next largest shareholder voting
against the resolution held just over 0.1% of the shares
able to be voted.
Where individual shareholders voted against our
policy, the Committee has sought to engage with
them to understand their concerns as part of
determining remuneration policy.
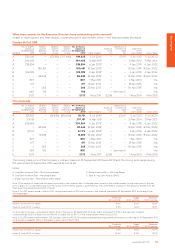
The table below shows the total remuneration figure for the CEO over the same five year period. The total remuneration figure
includes the annual bonus and LTIP awards which vested based on performance in those years. The annual bonus and LTIP
percentages show the payout for each year as a percentage of the maximum.
Year ended 30 September
2009 2010 2011 2012 2013
Single total figure of remuneration (£’000) 1,686 2,741 1,552 3,694 6,4351
Annual bonus (%) 88% 0% 63% 96% 87%
LTIP vesting (%) 0% 0% 0% 92% 100%
1 344,405 LTIP shares vesting for the period, share price is £13.254 (the average share price for the three months to 30 September 2013) an increase
of 292% on the share price at grant of £3.379.
Governance
Directors’ remuneration report continued