EasyJet 2013 Annual Report Download - page 33
Download and view the complete annual report
Please find page 33 of the 2013 EasyJet annual report below. You can navigate through the pages in the report by either clicking on the pages listed below, or by using the keyword search tool below to find specific information within the annual report.-
 1
1 -
2
-
3
-
4
-
5
-
6
-
7
-
8
-
9
-
10
-
11
-
12
-
13
-
14
-
15
-
16
-
17
-
18
-
19
-
20
-
21
-
22
-
 23
23 -
 24
24 -
 25
25 -
 26
26 -
 27
27 -
 28
28 -
 29
29 -
 30
30 -
 31
31 -
 32
32 -
 33
33 -
 34
34 -
 35
35 -
 36
36 -
 37
37 -
 38
38 -
 39
39 -
 40
40 -
 41
41 -
 42
42 -
 43
43 -
44
-
45
-
46
-
47
-
48
-
49
-
50
-
51
-
52
-
53
-
54
-
55
-
56
-
57
-
58
-
59
-
60
-
61
-
62
-
63
-
64
-
65
-
66
-
67
-
68
-
69
-
70
-
71
-
72
-
73
-
74
-
75
-
76
-
77
-
78
-
79
-
80
-
81
-
82
-
83
-
84
-
85
-
86
-
87
-
88
-
89
-
90
-
91
-
92
-
93
-
94
-
95
-
96
-
97
-
98
-
99
-
100
-
101
-
102
-
103
-
104
-
105
-
106
-
107
-
108
-
109
-
110
-
111
-
112
-
113
-
114
-
115
-
116
-
117
-
118
-
119
-
120
-
121
-
122
-
123
-
124
-
125
-
126
-
127
-
128
-
129
-
130
-
131
-
132
-
133
-
134
-
135
-
136
 |
 |

31
www.easyJet.com
Strategic report
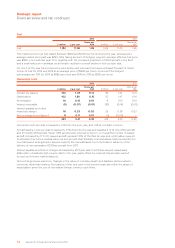
Excluding fuel, cost per seat grew by 5.3% to £38.17, and by 3.9% at constant currency; of this increase,
2.6% was due to increases in charges at regulated airports. A further 0.4% of the increase was due to the
increased need for de-icing following one of the longest periods of adverse weather experienced across
the network in the last few years. The increased proportion of A320 aircraft in the fleet delivered a cost per
seat reduction of 0.9%.
Fuel costs decreased slightly on a per seat basis, due to the increased proportion of A320 aircraft and a
slightly shorter average sector length. Our effective fuel price of $980 per tonne was in line with last year.
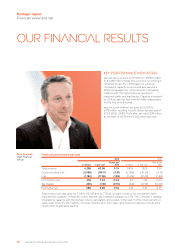
Profit before tax increased by £161 million (£2.22 per seat) to £478 million (£7.03 per seat).
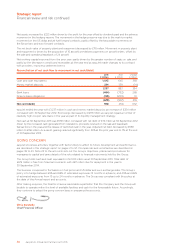
Tax charge for the year was £80 million. The significant majority of profits are subject to UK corporation tax
at 23.5%; the remainder being subject to Swiss corporate tax at 24.1%. The lower effective tax rate of 17% is
a consequence of legislation being enacted in the year reducing the UK corporation tax rate to 20% from
1 April 2015, which resulted in a reduction of the deferred tax element of the tax liability.
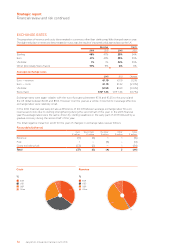
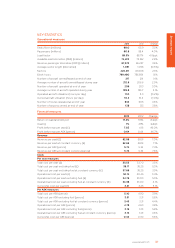
Earnings per share and dividends per share
2013
pence per
share
2012
pence per
share Change
Basic earnings per share 101.3 62.5 62.1%
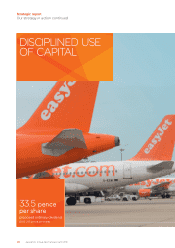
Proposed ordinary dividend 33.5 21.5 55.8%
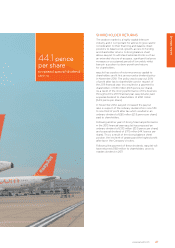
Proposed special dividend 44.1 ––
Basic earnings per share increased by 62.1% to 101.3 pence driven by the 56.1% increase in profit after tax
from £255 million to £398 million, and a 3.7% reduction in the weighted average number of ordinary shares.
The ordinary dividend grew by 55.8% to 33.5 pence per share. After taking into consideration the level of
liquidity in the business at the end of the financial year, the Board is additionally proposing to pay a special
dividend of £175 million (44.1 pence per share). The ordinary and special dividends are subject to shareholder
approval at the Company’s Annual General Meeting on 13 February 2014.
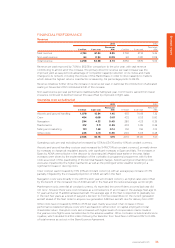
Return on capital employed and capital structure
2013 2012 Change
ROCE 17.4% 11.3% 6.1ppt
Gearing 7% 29% (22ppt)
ROCE for the year was 17.4%, an improvement of 6.1 percentage points from the prior year driven by the
increase in profit as average adjusted capital employed remained broadly in line with the prior year. Total
shareholder return for the year was 143.8% driven mainly by the increase in share price from £5.81 to £12.78.
Gearing decreased significantly to 7% (2012: 29%). This was a result of the significantly improved cash flow
performance, proceeds from sale and leasebacks and the release of restricted cash in the period.