EasyJet 2013 Annual Report Download - page 38
Download and view the complete annual report
Please find page 38 of the 2013 EasyJet annual report below. You can navigate through the pages in the report by either clicking on the pages listed below, or by using the keyword search tool below to find specific information within the annual report.-
 1
1 -
2
-
3
-
4
-
5
-
6
-
7
-
8
-
9
-
10
-
11
-
12
-
13
-
14
-
15
-
16
-
17
-
18
-
19
-
20
-
21
-
22
-
23
-
24
-
25
-
26
-
27
-
 28
28 -
 29
29 -
 30
30 -
 31
31 -
 32
32 -
 33
33 -
 34
34 -
 35
35 -
 36
36 -
 37
37 -
 38
38 -
 39
39 -
 40
40 -
 41
41 -
 42
42 -
 43
43 -
 44
44 -
 45
45 -
 46
46 -
 47
47 -
 48
48 -
49
-
50
-
51
-
52
-
53
-
54
-
55
-
56
-
57
-
58
-
59
-
60
-
61
-
62
-
63
-
64
-
65
-
66
-
67
-
68
-
69
-
70
-
71
-
72
-
73
-
74
-
75
-
76
-
77
-
78
-
79
-
80
-
81
-
82
-
83
-
84
-
85
-
86
-
87
-
88
-
89
-
90
-
91
-
92
-
93
-
94
-
95
-
96
-
97
-
98
-
99
-
100
-
101
-
102
-
103
-
104
-
105
-
106
-
107
-
108
-
109
-
110
-
111
-
112
-
113
-
114
-
115
-
116
-
117
-
118
-
119
-
120
-
121
-
122
-
123
-
124
-
125
-
126
-
127
-
128
-
129
-
130
-
131
-
132
-
133
-
134
-
135
-
136
 |
 |

36 easyJet plc Annual report and accounts 2013
Strategic report
Financial review and risk continued
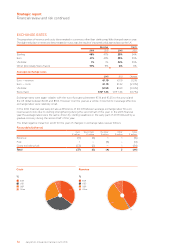
Net assets increased by £223 million driven by the profit for the year offset by dividends paid and the adverse
movement in the hedging reserve. The movement in the hedging reserve was due to the mark-to-market
movement on the US dollar and jet fuel forward contracts, partly offset by the favourable movements on
the Swiss franc and euro forward contracts.
The net book value of property plant and equipment decreased by £115 million. Movement in property plant
and equipment is driven by the acquisition of 10 aircraft, pre-delivery payments on aircraft orders, offset by
the sale and operating leaseback of 24 aircraft.
Net working capital improved from the prior year, partly driven by the greater number of seats on sale, and
partly by the decrease in credit card receivables at the year end as easyJet made changes to its contract
with providers, improving settlement terms.
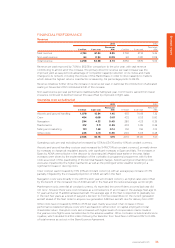
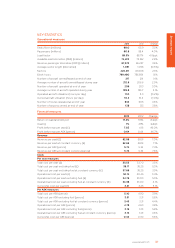
Reconciliation of net cash flow to movement in net cash/(debt)
2013
£ million
2012
£ million
Change
£ million
Cash and cash equivalents 1,013 645 368
Money market deposits 224 238 (14)
1,237 883 354
Bank loans (484) (752) 268
Finance lease obligations (195) (205) 10
(679) (957) 278
Net cash/(debt) 558 (74) 632
easyJet ended the year with £1,237 million in cash and money market deposits; an increase of £354 million
compared with 30 September 2012. Borrowings decreased by £278 million as easyJet repaid a number of
relatively high-coupon rate loans in the year as part of its liquidity management strategy.
Net cash at 30 September 2013 was £558 million compared with net debt of £74 million at 30 September 2012
driven by the increased cash generated from operations, proceeds received on the sale and leaseback
transactions in the year and the release of restricted cash in the year. Adjusted net debt decreased by £583
million to £156 million. As a result, gearing reduced significantly from 29% at the prior year end to 7% at the end
of 30 September 2013.
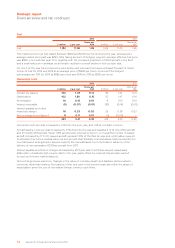
GOING CONCERN
easyJet’s business activities, together with factors likely to affect its future development and performance,
are described in this strategic report on pages 2 to 57. Principal risks and uncertainties are described on
pages 38 to 43. Note 22 to the accounts sets out the Group’s objectives, policies and procedures for
managing its capital and gives details of the risks related to financial instruments held by the Group.
The Group holds cash and cash equivalents of £1,013 million as at 30 September 2013. Total debt of
£679 million is free from financial covenants, with £87 million due for repayment in the year to
30 September 2014.
The business is exposed to fluctuations in fuel prices and US dollar and euro exchange rates. The Group’s
policy is to hedge between 65% and 85% of estimated exposures 12 months in advance, and 45% and 65%
of estimated exposures from 13 up to 24 months in advance. The Group was compliant with this policy at
the date of this Annual report and accounts.
After making enquiries, the Directors have a reasonable expectation that the Company and the Group will
be able to operate within the level of available facilities and cash for the foreseeable future. Accordingly,
they continue to adopt the going concern basis in preparing the accounts.
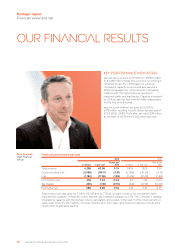
Chris Kennedy
Chief Financial Officer