EasyJet 2013 Annual Report Download - page 86
Download and view the complete annual report
Please find page 86 of the 2013 EasyJet annual report below. You can navigate through the pages in the report by either clicking on the pages listed below, or by using the keyword search tool below to find specific information within the annual report.-
 1
1 -
2
-
3
-
4
-
5
-
6
-
7
-
8
-
9
-
10
-
11
-
12
-
13
-
14
-
15
-
16
-
17
-
18
-
19
-
20
-
21
-
22
-
23
-
24
-
25
-
26
-
27
-
28
-
29
-
30
-
31
-
32
-
33
-
34
-
35
-
36
-
37
-
38
-
39
-
40
-
41
-
42
-
43
-
44
-
45
-
46
-
47
-
48
-
49
-
50
-
51
-
52
-
53
-
54
-
55
-
56
-
57
-
58
-
59
-
60
-
61
-
62
-
63
-
64
-
65
-
66
-
67
-
68
-
69
-
70
-
71
-
72
-
73
-
74
-
75
-
 76
76 -
 77
77 -
 78
78 -
 79
79 -
 80
80 -
 81
81 -
 82
82 -
 83
83 -
 84
84 -
 85
85 -
 86
86 -
 87
87 -
 88
88 -
 89
89 -
 90
90 -
 91
91 -
 92
92 -
 93
93 -
 94
94 -
 95
95 -
 96
96 -
97
-
98
-
99
-
100
-
101
-
102
-
103
-
104
-
105
-
106
-
107
-
108
-
109
-
110
-
111
-
112
-
113
-
114
-
115
-
116
-
117
-
118
-
119
-
120
-
121
-
122
-
123
-
124
-
125
-
126
-
127
-
128
-
129
-
130
-
131
-
132
-
133
-
134
-
135
-
136
 |
 |

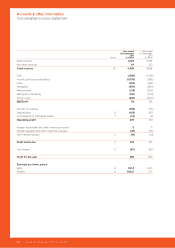
easyJet plc Annual report and accounts 2013
84
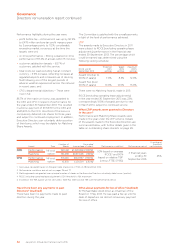
Performance highlights during the year were:
• profit before tax – Achievement was up by 50.9%
to £478 million and pre-tax profit margins grew
by 3 percentage points to 11.2%, considerably
exceeding market consensus at the time the
targets were set;
• on-time performance – Strong sustained on-time
performance of 87.4% of arrivals within 15 minutes;
• customer satisfaction targets – 82.7% of
customers satisfied with the service;
• total costs per seat excluding fuel at constant
currency – 3.9% increase, reflecting increases at
regulated airports and increased use of de-icing
fluid following one of the longest periods of
adverse weather experienced across the network
in recent years; and
• CFO’s departmental objectives – These were
met in full.
86.7% of the maximum bonus was awarded to
the CEO and CFO in respect of performance for
the year ended 30 September 2013. This resulted
in a bonus payment of £1,153,110 to the CEO and
£533,205 to the CFO. One-third of the bonus is
compulsorily deferred into shares for three years
and subject to continued employment. In addition,
Executive Directors can voluntarily defer a portion
of their bonus which may be eligible for Matching
Share Awards.
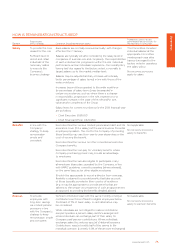
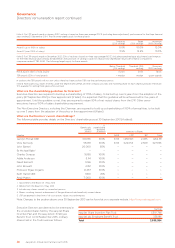
Award Type
Number of
Shares
Face value1
(percentage of salary) Performance condition2Performance period
% vesting at
threshold
performance
CEO Performance Nil cost
option
180,461 £1,329,998 (200%) 50% based on average
ROCE4 and 50%
based on relative TSR5
(versus FTSE 51-150)
3 financial years
ending 30
September 2015
25%
Matching 86,438 £637,048 (96%)3
CFO Performance Nil cost
option
83,446 £614,997 (150%)
Matching 16,878 £124,391 (30%)3
1 Face value calculated based on the grant date share price of 737p on 18 December 2012.
2 Performance conditions are set out on pages 76 and 77.
3 Matching awards are granted over an equal number of shares as the Executive Directors voluntarily defer bonus (pre-tax).
4 ROCE (including operating lease adjustments) 12% threshold to 16% maximum.
5 In addition, the TSR awards will not vest unless there has been positive TSR over the performance period.
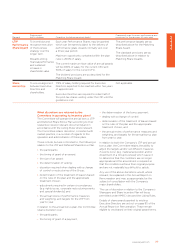
Have there been any payments to past
Directors? (Audited)
There have been no payments made to past
directors during the year.
What about payments for loss of office? (Audited)
Sir Michael Rake stood down as Chairman of the
Board on 1 May 2013. He was paid a fee up until his
date of departure. He did not receive any payment
for loss of office.
The Committee is satisfied with the overall payments
in light of the level of performance achieved.
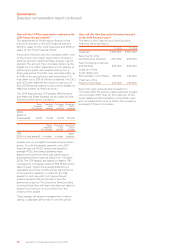
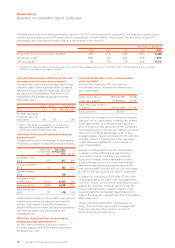
LTIP
The awards made to Executive Directors in 2011
were subject to ROCE (excluding operating lease
adjustments) performance in the financial year
ended 30 September 2013. The percentage which
could be earned was determined using the
following vesting schedule:
ROCE y/e 30
September 2013
Threshold
(25%
vesting)
Target
(50%
vesting)
Maximum
(100%
vesting)
Award One (up to
100% of salary) 7.0% 8.5% 12.0%
Award Two (over
100% of salary) 10.0% 12.0% 13.0%
There were no Matching Awards made in 2011.
ROCE (excluding operating lease adjustments)
in the year ended 30 September 2013 was 23%;
correspondingly 100% of awards are due to vest
in March 2014, subject to continued service.
What LTIP awards were granted to Directors
in the year?
Performance and Matching Share Awards were
made in the year under the LTIP scheme. Details
of the awards made to the Executive Directors are
summarised below, with further details given in the
table on outstanding share interests on page 85.
Governance
Directors’ remuneration report continued