EasyJet 2013 Annual Report Download - page 119
Download and view the complete annual report
Please find page 119 of the 2013 EasyJet annual report below. You can navigate through the pages in the report by either clicking on the pages listed below, or by using the keyword search tool below to find specific information within the annual report.-
 1
1 -
2
-
3
-
4
-
5
-
6
-
7
-
8
-
9
-
10
-
11
-
12
-
13
-
14
-
15
-
16
-
17
-
18
-
19
-
20
-
21
-
22
-
23
-
24
-
25
-
26
-
27
-
28
-
29
-
30
-
31
-
32
-
33
-
34
-
35
-
36
-
37
-
38
-
39
-
40
-
41
-
42
-
43
-
44
-
45
-
46
-
47
-
48
-
49
-
50
-
51
-
52
-
53
-
54
-
55
-
56
-
57
-
58
-
59
-
60
-
61
-
62
-
63
-
64
-
65
-
66
-
67
-
68
-
69
-
70
-
71
-
72
-
73
-
74
-
75
-
76
-
77
-
78
-
79
-
80
-
81
-
82
-
83
-
84
-
85
-
86
-
87
-
88
-
89
-
90
-
91
-
92
-
93
-
94
-
95
-
96
-
97
-
98
-
99
-
100
-
101
-
102
-
103
-
104
-
105
-
106
-
107
-
108
-
 109
109 -
 110
110 -
 111
111 -
 112
112 -
 113
113 -
 114
114 -
 115
115 -
 116
116 -
 117
117 -
 118
118 -
 119
119 -
 120
120 -
 121
121 -
 122
122 -
 123
123 -
 124
124 -
 125
125 -
 126
126 -
 127
127 -
 128
128 -
 129
129 -
130
-
131
-
132
-
133
-
134
-
135
-
136
 |
 |

www.easyJet.com
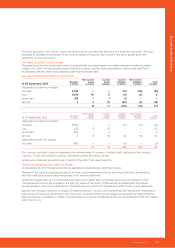
$FFRXQWVRWKHULQIRUPDWLRQ
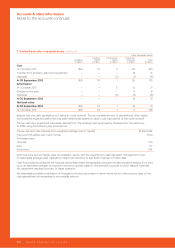
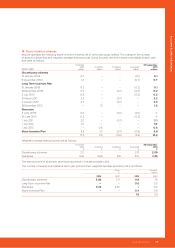
Grant date
Share
price
£
Exercise
price
£
Expected
volatility
%
Option life
years
Risk-free
interest rate
%
Fair
value
£
'LVFUHWLRQDU\VFKHPHV
19 January 2004 3.80 3.60 40% 6.5 4.62% 1.90
8 December 2004 1.81 1.84 42% 6.5 4.45% 0.88
/RQJ7HUP,QFHQWLYH3ODQ
16 January 2009 2.88 – – – – 2.88
16 December 2009 and 5 July 2010 3.49 – – – – 3.49
31 March 2011 3.41 – – – – 3.41
4 January 2012 3.92 – – – – 3.92
18 December 2012 – ROCE 7.37 – – – – 6.92
18 December 2012 – TSR 7.37 – 33% 3.0 0.44% 5.16
6KDUHVDYH
1 July 2011 3.60 2.88 46% 3.5 1.45% 1.37
1 July 2012 5.23 4.18 35% 3.5 0.24% 1.77
1 July 2013 12.11 9.69 34% 3.5 0.32% 3.54
Share price is the closing share price from the last working day prior to the date of grant.
Exercise price for the discretionary schemes was determined using a five-day weighted average price. For the Sharesave
scheme, exercise price is set at a 20% discount from share price.
Expected volatility is based on historical volatility over a period comparable to the expected life of each type of option.
Levels of early exercises and forfeitures are estimated using historical averages.
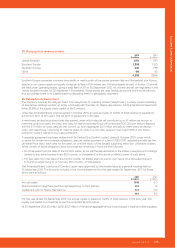
The weighted average fair value of matching shares granted under the Share Incentive Plan during the year was
£9.77 (2012: £4.96).
For grants under the Sharesave scheme after 30 September 2011, the dividend yield assumption is calculated based on
the actual yield at the date the options are granted. For the options granted on 1 July 2012 and 1 July 2013, the dividend
yield assumption was 2%.
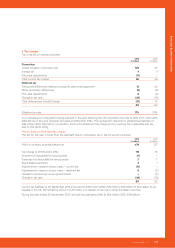
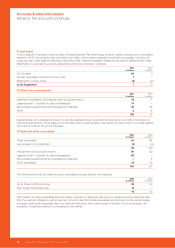
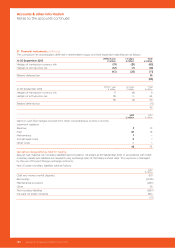
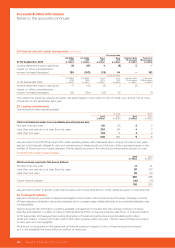
5HFRQFLOLDWLRQRIRSHUDWLQJSURILWWRFDVKJHQHUDWHGIURPRSHUDWLRQV
PLOOLRQ
2012
£ million
Operating profit 331
$GMXVWPHQWVIRUQRQFDVKLWHPV
Depreciation 97
Loss on disposal of property, plant and equipment ± 1
Amortisation of intangible assets 8
Share-based payments 12
&KDQJHVLQZRUNLQJFDSLWDODQGRWKHULWHPVRIDQRSHUDWLQJQDWXUH
Decrease/(increase) in trade and other receivables (44)
Increase in trade and other payables 74
Increase in provisions 18
Decrease in other non-current assets 6
Increase in derivative financial instruments ± 4
Decrease in non-current deferred income (13)
494
117
www.easyJet.com
Accounts & other information