EasyJet 2013 Annual Report Download - page 133
Download and view the complete annual report
Please find page 133 of the 2013 EasyJet annual report below. You can navigate through the pages in the report by either clicking on the pages listed below, or by using the keyword search tool below to find specific information within the annual report.-
 1
1 -
2
-
3
-
4
-
5
-
6
-
7
-
8
-
9
-
10
-
11
-
12
-
13
-
14
-
15
-
16
-
17
-
18
-
19
-
20
-
21
-
22
-
23
-
24
-
25
-
26
-
27
-
28
-
29
-
30
-
31
-
32
-
33
-
34
-
35
-
36
-
37
-
38
-
39
-
40
-
41
-
42
-
43
-
44
-
45
-
46
-
47
-
48
-
49
-
50
-
51
-
52
-
53
-
54
-
55
-
56
-
57
-
58
-
59
-
60
-
61
-
62
-
63
-
64
-
65
-
66
-
67
-
68
-
69
-
70
-
71
-
72
-
73
-
74
-
75
-
76
-
77
-
78
-
79
-
80
-
81
-
82
-
83
-
84
-
85
-
86
-
87
-
88
-
89
-
90
-
91
-
92
-
93
-
94
-
95
-
96
-
97
-
98
-
99
-
100
-
101
-
102
-
103
-
104
-
105
-
106
-
107
-
108
-
109
-
110
-
111
-
112
-
113
-
114
-
115
-
116
-
117
-
118
-
119
-
120
-
121
-
122
-
 123
123 -
 124
124 -
 125
125 -
 126
126 -
 127
127 -
 128
128 -
 129
129 -
 130
130 -
 131
131 -
 132
132 -
 133
133 -
 134
134 -
 135
135 -
 136
136
 |
 |

www.easyJet.com
$FFRXQWVRWKHULQIRUPDWLRQ
$FFRXQWVRWKHULQIRUPDWLRQ
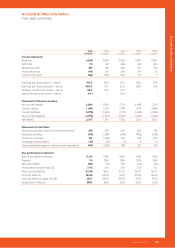
Five year summary
PLOOLRQ
2012
£ million
2011
£ million
2010
£ million
2009
£ million
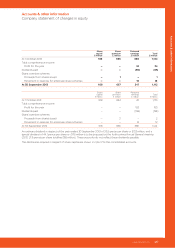
,QFRPHVWDWHPHQW
Revenue 3,854 3,452 2,973 2,667
EBITDAR 531 468 361 225
Operating profit 331 269 174 60
Profit before tax 317 248 154 55
Profit for the year 255 225 121 71
Earnings per share (basic) – pence 62.5 52.5 28.4 16.9
Earnings per share (diluted) – pence 61.7 52.0 28.0 16.6
Ordinary dividend per share – pence 21.5 10.5 – –
Special dividend per share – pence –34.9 – –
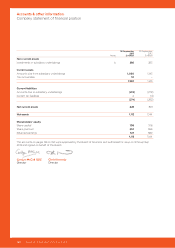
6WDWHPHQWRIILQDQFLDOSRVLWLRQ
Non-current assets 2,968 2,731 2,488 2,191
Current assets 1,327 1,738 1,515 1,482
Current liabilities (1,264) (1,177) (1,065) (1,062)
Non-current liabilities (1,237) (1,587) (1,437) (1,304)
Net assets 1,794 1,705 1,501 1,307
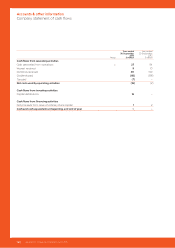
6WDWHPHQWRIFDVKIORZV
Operating activities (net of dividend payments) 261 424 363 134
Investing activities (389) (478) (482) (430)
Financing activities (309) 246 233 440
Exchange (losses)/gains (18) (4) 9 12
Net increase/(decrease) in cash and cash equivalents (455) 188 123 156
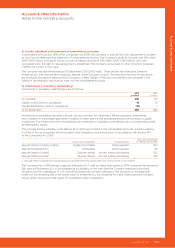
.H\SHUIRUPDQFHLQGLFDWRUV
Return on capital employed 11.3% 9.8% 6.9% 3.6%
Gearing 29% 28% 32% 38%
Net cash/(debt) (74) 100 (40) (46)
Profit before tax per seat (£) 4.81 3.97 2.75 1.04
Revenue per seat (£) 58.51 55.27 53.07 50.47
Cost per seat (£) 53.70 51.30 50.32 49.43
Cost per seat excluding fuel (£) 36.25 36.62 37.23 34.16
Seats flown (millions) 65.9 62.5 56.0 52.8
131
www.easyJet.com
Accounts & other information