EasyJet 2013 Annual Report Download - page 32
Download and view the complete annual report
Please find page 32 of the 2013 EasyJet annual report below. You can navigate through the pages in the report by either clicking on the pages listed below, or by using the keyword search tool below to find specific information within the annual report.-
 1
1 -
2
-
3
-
4
-
5
-
6
-
7
-
8
-
9
-
10
-
11
-
12
-
13
-
14
-
15
-
16
-
17
-
18
-
19
-
20
-
21
-
 22
22 -
 23
23 -
 24
24 -
 25
25 -
 26
26 -
 27
27 -
 28
28 -
 29
29 -
 30
30 -
 31
31 -
 32
32 -
 33
33 -
 34
34 -
 35
35 -
 36
36 -
 37
37 -
 38
38 -
 39
39 -
 40
40 -
 41
41 -
 42
42 -
43
-
44
-
45
-
46
-
47
-
48
-
49
-
50
-
51
-
52
-
53
-
54
-
55
-
56
-
57
-
58
-
59
-
60
-
61
-
62
-
63
-
64
-
65
-
66
-
67
-
68
-
69
-
70
-
71
-
72
-
73
-
74
-
75
-
76
-
77
-
78
-
79
-
80
-
81
-
82
-
83
-
84
-
85
-
86
-
87
-
88
-
89
-
90
-
91
-
92
-
93
-
94
-
95
-
96
-
97
-
98
-
99
-
100
-
101
-
102
-
103
-
104
-
105
-
106
-
107
-
108
-
109
-
110
-
111
-
112
-
113
-
114
-
115
-
116
-
117
-
118
-
119
-
120
-
121
-
122
-
123
-
124
-
125
-
126
-
127
-
128
-
129
-
130
-
131
-
132
-
133
-
134
-
135
-
136
 |
 |

30 easyJet plc Annual report and accounts 2013
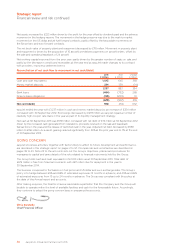
Chris Kennedy
Chief Financial
Officer
Strategic report
Financial review and risk
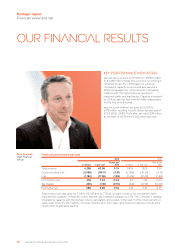
OUR FINANCIAL RESULTS
KEY PERFORMANCE INDICATORS
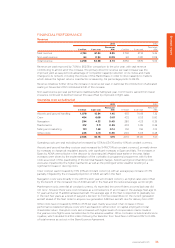
easyJet grew revenue by 10.5% from £3,854 million
to £4,258 million. Whilst the economic environment
remained tough, the combination of a benign
competitor capacity environment and easyJet’s
efficient management of its network in targeting
markets with the highest returns has driven
improved yields and load factor. Capacity increased
by 3.3% as easyJet flew over 60 million passengers
for the first time this year.
easyJet’s profit before tax grew by 50.9% to
£478 million, resulting in profit before tax per seat of
£7.03 (2012: £4.81). Profit after tax was £398 million,
an increase of 56.1% from £255 million last year.
Financial performance per seat
2013 2012
£ million £ per seat
Pence per
ASK £ million £ per seat
Pence per
ASK
Total revenue 4,258 62.58 5.74 3,854 58.51 5.34
Costs excluding fuel (2,598) (38.17) (3.51) (2,388) (36.25) (3.31)
Fuel (1,182) (17.38) (1.59) (1,149) (17.45) (1.59)
Profit before tax 478 7.03 0.64 317 4.81 0.44
Tax charge (80) (1.18) (0.10) (62) (0.94) (0.09)
Profit after tax 398 5.85 0.54 255 3.87 0.35
Total revenue per seat grew by 7.0% to £62.58 and by 7.1% at constant currency. As competitors have
reduced their capacity on easyJet routes, easyJet has increased capacity by 3.3%. The Company’s strategy
of targeting capacity with the highest returns generated strong yields in the year. Further improvements in
yields were driven by the maturity of routes introduced in prior years, and revenue initiatives, including the
introduction of allocated seating.