EasyJet 2013 Annual Report Download - page 31
Download and view the complete annual report
Please find page 31 of the 2013 EasyJet annual report below. You can navigate through the pages in the report by either clicking on the pages listed below, or by using the keyword search tool below to find specific information within the annual report.-
 1
1 -
2
-
3
-
4
-
5
-
6
-
7
-
8
-
9
-
10
-
11
-
12
-
13
-
14
-
15
-
16
-
17
-
18
-
19
-
20
-
 21
21 -
 22
22 -
 23
23 -
 24
24 -
 25
25 -
 26
26 -
 27
27 -
 28
28 -
 29
29 -
 30
30 -
 31
31 -
 32
32 -
 33
33 -
 34
34 -
 35
35 -
 36
36 -
 37
37 -
 38
38 -
 39
39 -
 40
40 -
 41
41 -
42
-
43
-
44
-
45
-
46
-
47
-
48
-
49
-
50
-
51
-
52
-
53
-
54
-
55
-
56
-
57
-
58
-
59
-
60
-
61
-
62
-
63
-
64
-
65
-
66
-
67
-
68
-
69
-
70
-
71
-
72
-
73
-
74
-
75
-
76
-
77
-
78
-
79
-
80
-
81
-
82
-
83
-
84
-
85
-
86
-
87
-
88
-
89
-
90
-
91
-
92
-
93
-
94
-
95
-
96
-
97
-
98
-
99
-
100
-
101
-
102
-
103
-
104
-
105
-
106
-
107
-
108
-
109
-
110
-
111
-
112
-
113
-
114
-
115
-
116
-
117
-
118
-
119
-
120
-
121
-
122
-
123
-
124
-
125
-
126
-
127
-
128
-
129
-
130
-
131
-
132
-
133
-
134
-
135
-
136
 |
 |
29
www.easyJet.com
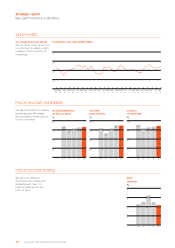
Strategic report
We are committed to
improving shareholder returns
whilst remaining prudently
financed with a strong, liquid
balance sheet.
FINANCIALLY STRONG
We are focused on improving
our routes, slots and bases to
build on our leading presence
across Europe.
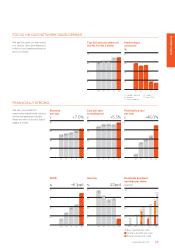
FOCUS ON OUR NETWORK DEVELOPMENT
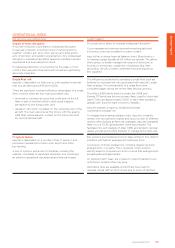
Top 100 airports where we
are No.1 or No.2 airline
6
12
18
24
1312111009
18
21 21
19 19
Market share
of airports
%
15
30
45
60
EDCBA
A London Gatwick
B Geneva
C Milan Malpensa
43
39 40
13 11
D Lisbon
E Paris CDG
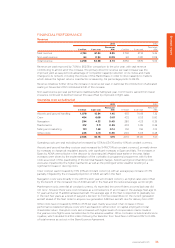
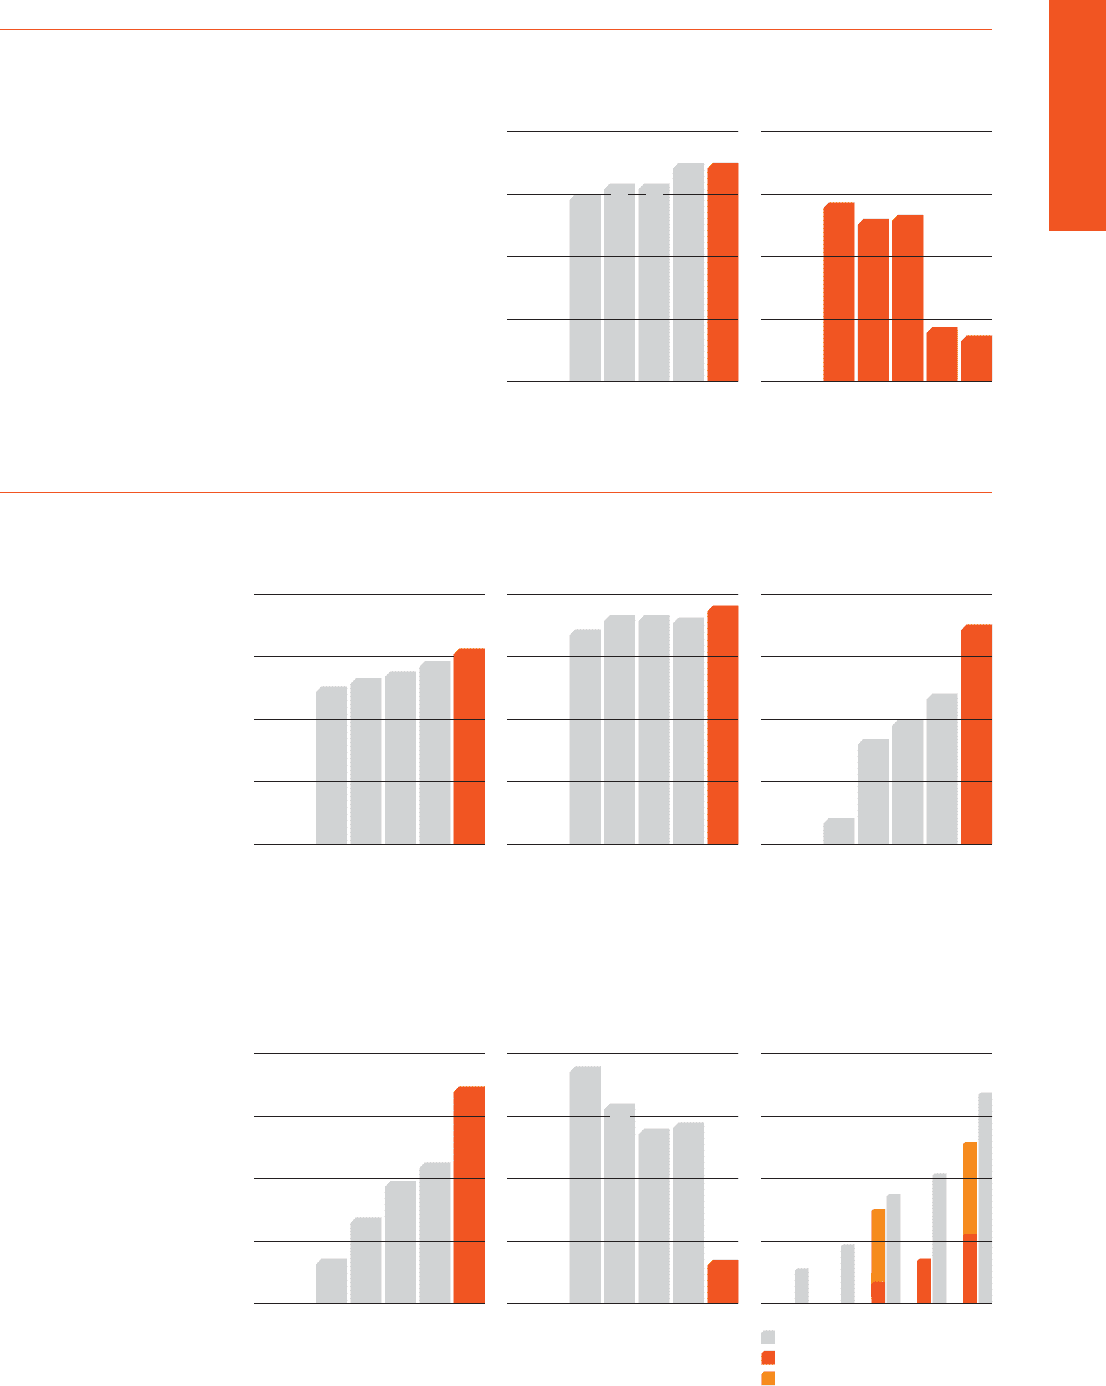
Revenue
per seat
£
20
40
60
80
+7.0%
1312111009
50.47 53.07 55.27 58.51
62.58
62.58
Cost per seat
excluding fuel
£
10
20
30
40
+5.3%
1312111009
34.37
36.62 36.62 36.25
38.17
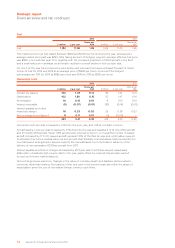
Profit before tax/
per seat
£
2
4
6
8
+46.0%
1312111009
0.83
3.36
3.97
4.81
7. 0 3
ROCE
%
5
10
15
20
+6.1ppt
1312111009
3.6
6.9
9.8
11.3
17.4
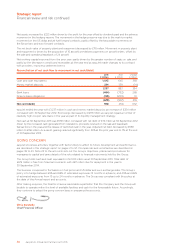
Gearing
%
10
20
30
40
-22ppt
1312111009
38
28 29
7
32
Dividends and basic
earnings per share
pence
30
60
90
120
1312111009
Ordinary dividend per share
Basic earnings per share
Special dividend per share
16.9
28.4
45.4
52.5
21.5
62.5
77.6
101.3