EasyJet 2013 Annual Report Download - page 87
Download and view the complete annual report
Please find page 87 of the 2013 EasyJet annual report below. You can navigate through the pages in the report by either clicking on the pages listed below, or by using the keyword search tool below to find specific information within the annual report.-
 1
1 -
2
-
3
-
4
-
5
-
6
-
7
-
8
-
9
-
10
-
11
-
12
-
13
-
14
-
15
-
16
-
17
-
18
-
19
-
20
-
21
-
22
-
23
-
24
-
25
-
26
-
27
-
28
-
29
-
30
-
31
-
32
-
33
-
34
-
35
-
36
-
37
-
38
-
39
-
40
-
41
-
42
-
43
-
44
-
45
-
46
-
47
-
48
-
49
-
50
-
51
-
52
-
53
-
54
-
55
-
56
-
57
-
58
-
59
-
60
-
61
-
62
-
63
-
64
-
65
-
66
-
67
-
68
-
69
-
70
-
71
-
72
-
73
-
74
-
75
-
76
-
 77
77 -
 78
78 -
 79
79 -
 80
80 -
 81
81 -
 82
82 -
 83
83 -
 84
84 -
 85
85 -
 86
86 -
 87
87 -
 88
88 -
 89
89 -
 90
90 -
 91
91 -
 92
92 -
 93
93 -
 94
94 -
 95
95 -
 96
96 -
 97
97 -
98
-
99
-
100
-
101
-
102
-
103
-
104
-
105
-
106
-
107
-
108
-
109
-
110
-
111
-
112
-
113
-
114
-
115
-
116
-
117
-
118
-
119
-
120
-
121
-
122
-
123
-
124
-
125
-
126
-
127
-
128
-
129
-
130
-
131
-
132
-
133
-
134
-
135
-
136
 |
 |

www.easyJet.com 85
Governance
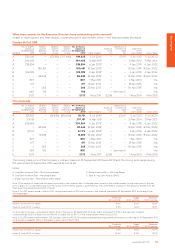
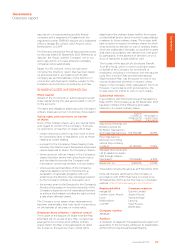
What share awards do the Executive Directors have outstanding at the year end?
Details of share options and share awards outstanding at the year end are shown in the following tables (Audited):
Carolyn McCall OBE
Scheme
No. of shares/
options at
30 September
20121
Shares/
options
granted
in year
Shares/
options
lapsed
in year
Shares/
options
exercised
in year
No. of shares/
options at
30 September
20131Date of grant
Exercise
price
(£)
Market price
on exercise
date
(£)
Date from
which
exercisable Expiry Date
A 335,096 – (27,981) (107,490) 199,625 5 Jul 20102– £11.97 5 Jul 2013 5 Jul 2020
A 344,405 – – – 344,405 31 Mar 20113– – 31 Mar 2014 31 Mar 2021
A 338,594 – – – 338,594 4 Jan 20124– – 4 Jan 2015 4 Jan 2022
A – 180,461 – – 180,461 18 Dec 2012518 Dec 2016 18 Dec 2022
B 106,978 – – – 106,978 4 Jan 20124– – 4 Jan 2015 4 Jan 2022
B – 86,438 – – 86,438 18 Dec 20125– – 18 Dec 2016 18 Dec 2022
C 807 – – – 807 1 May 2011 – – 1 May 2014 n/a
C 617 – – – 617 18 Apr 2012 – – 18 Apr 2015 n/a
C –265––265 30 Apr 2013 – – 30 Apr 2016 n/a
D 640 156 – – 796 – – See note 6 – n/a
E 3,133 – – – 3,133 1 Aug 2011 £2.88 – 1 Aug 2014 1 Feb 2015
Chris Kennedy
Scheme
No. of shares/
options at
30 September
20121
Shares/
options
granted
in year
Shares/
options
lapsed
in year
Shares/
options
exercised
in year
No. of shares/
options at
30 September
20131Date of grant
Exercise
price
(£)
Market price
on exercise
date
(£)
Date from
which
exercisable Expiry Date
A 201,562 – (16,830) (106,001) 78,731 5 Jul 20102– £12.01 5 Jul 2013 5 Jul 2020
A 207,161 – – – 207,161 31 Mar 20113– – 31 Mar 2014 31 Mar 2021
A 203,664 – – – 203,664 4 Jan 20124– – 4 Jan 2015 4 Jan 2022
A – 83,446 – – 83,446 18 Dec 2012518 Dec 2016 18 Dec 2022
B 32,174 – – – 32,174 4 Jan 20124– – 4 Jan 2015 4 Jan 2022
B – 16,878 – – 16,878 18 Dec 20125– – 18 Dec 2016 18 Dec 2022
C 807 – – – 807 1 May 2011 – – 1 May 2014 n/a
C 617 – – – 617 18 Apr 2012 – – 18 Apr 2015 n/a
C –265––265 30 Apr 2013 – – 30 Apr 2016 n/a
D 664 156 – – 820 – – See note 6 – n/a
E 3,133 – – – 3,133 1 Aug 2011 £2.88 – 1 Aug 2014 1 Feb 2015
The closing share price of the Company’s ordinary shares at 30 September 2013 was £12.78 and the closing price range during
the year ended 30 September 2013 was £5.92 to £14.48.
Notes
A Long Term Incentive Plan – Performance Shares
B Long Term Incentive Plan – Matching Shares
C Share Incentive Plan – Performance (Free) Shares
D Share Incentive Plan – Matching Shares
E Save As You Earn Awards (SAYE)
Note 1: The number of shares are calculated according to the scheme rules of individual plans based on the middle-market closing share price of the day
prior to grant. As is usual market practice, the option price for SAYE awards is determined by the Committee in advance of the award by reference to the
share price following announcement of results.
Note 2: For LTIP awards made in March 2010, vesting was based on ROE performance in the financial year ended 30 September 2012, according to the
following targets:
Threshold
(25% vesting)
Target
(50% vesting)
Maximum
(100% vesting)
Award 1 (up to 100% of salary) 9.0% 12.0% 15.0%
Award 2 (over 100% of salary) 11.0% 13.0% 15.0%
As disclosed in last year’s remuneration report, ROE in the year to 30 September 2012 was 14.6% (compared to 5.5% in the year prior to grant).
Correspondingly 93.3% of award one and 90.0% of award two (or 91.7% of the overall award) vested in July 2013.
Note 3: For LTIP awards made in March 2011, vesting is based on ROCE (excluding operating leases adjustment) performance for the year to 30 September 2013.
As disclosed on page 84, 100% of the award is due to vest in March 2014.
Threshold
(25% vesting)
Target
(50% vesting)
Maximum
(100% vesting)
Award 1 (up to 100% of salary) 7.0% 8.5% 12.0%
Award 2 (over 100% of salary) 10.0% 12.0% 13.0%