Dish Network 2011 Annual Report Download - page 74
Download and view the complete annual report
Please find page 74 of the 2011 Dish Network annual report below. You can navigate through the pages in the report by either clicking on the pages listed below, or by using the keyword search tool below to find specific information within the annual report.-
 1
1 -
2
-
3
-
4
-
5
-
6
-
7
-
8
-
9
-
10
-
11
-
12
-
13
-
14
-
15
-
16
-
17
-
18
-
19
-
20
-
21
-
22
-
23
-
24
-
25
-
26
-
27
-
28
-
29
-
30
-
31
-
32
-
33
-
34
-
35
-
36
-
37
-
38
-
39
-
40
-
41
-
42
-
43
-
44
-
45
-
46
-
47
-
48
-
49
-
50
-
51
-
52
-
53
-
54
-
55
-
56
-
57
-
58
-
59
-
60
-
61
-
62
-
63
-
 64
64 -
 65
65 -
 66
66 -
 67
67 -
 68
68 -
 69
69 -
 70
70 -
 71
71 -
 72
72 -
 73
73 -
 74
74 -
 75
75 -
 76
76 -
 77
77 -
 78
78 -
 79
79 -
 80
80 -
 81
81 -
 82
82 -
 83
83 -
 84
84 -
85
-
86
-
87
-
88
-
89
-
90
-
91
-
92
-
93
-
94
-
95
-
96
-
97
-
98
-
99
-
100
-
101
-
102
-
103
-
104
-
105
-
106
-
107
-
108
-
109
-
110
-
111
-
112
-
113
-
114
-
115
-
116
-
117
-
118
-
119
-
120
-
121
-
122
-
123
-
124
-
125
-
126
-
127
-
128
-
129
-
130
-
131
-
132
-
133
-
134
-
135
-
136
-
137
-
138
-
139
-
140
-
141
-
142
-
143
-
144
-
145
-
146
-
147
-
148
-
149
-
150
-
151
-
152
-
153
-
154
-
155
-
156
-
157
-
158
-
159
-
160
-
161
-
162
-
163
-
164
 |
 |
Item 7. MANAGEMENT’S DISCUSSION AND ANALYSIS OF FINANCIAL CONDITION AND
RESULTS OF OPERATIONS - Continued
64
64
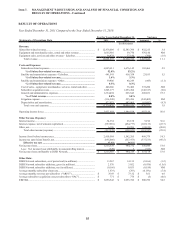
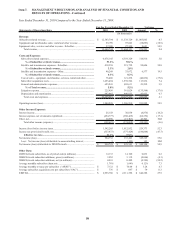
The decrease in free cash flow from 2009 to 2010 of $234 million resulted from a decrease in “Net cash flows from
operating activities” of $55 million or 2.5% and an increase in “Purchases of property and equipment” of $179 million
or 17.3%. The decrease in “Net cash flows from operating activities” was primarily attributable to a $605 million
decrease in cash resulting from changes in operating assets and liabilities, partially offset by a $543 million increase in
net income, adjusted to exclude non-cash changes in “Deferred tax expense (benefit),” “Realized and unrealized losses
(gains) on investments,” and “Depreciation and amortization” expense. The decrease in cash resulting from changes in
operating assets and liabilities is principally attributable to the increase in inventory and timing differences between
book expense and cash payments, primarily related to income taxes and litigation expense. The increase in “Purchases
of property and equipment” in 2010 was primarily attributable to the assignment of certain rights under a launch
contract for EchoStar XV and an increase in expenditures for equipment under our lease program for new subscribers.
Cash flows from operating activities. We typically reinvest the cash flow from operating activities in our business
primarily to grow our subscriber base and to expand our infrastructure. For the years ended December 31, 2011,
2010 and 2009, we reported net cash flows from operating activities of $2.574 billion, $2.140 billion, and $2.195
billion, respectively. See discussion of changes in net cash flows from operating activities included in “Free cash
flow” above.
Cash flows from investing activities. Our investing activities generally include purchases and sales of marketable
investment securities, acquisitions, strategic investments and cash used to grow our subscriber base and expand our
infrastructure. For the years ended December 31, 2011, 2010 and 2009, we reported net cash outflows from investing
activities of $2.695 billion, $1.478 billion and $2.606 billion, respectively. During the years ended December 31, 2011,
2010 and 2009, capital expenditures for new and existing customer equipment totaled $701 million, $942 million and
$876 million, respectively.
The increase in net cash outflows from investing activities from 2010 to 2011 of $1.218 billion primarily resulted from
our investment in DBSD North America of $1.139 billion, the TerreStar Transaction of $1.345 billion, the Blockbuster
Acquisition of $127 million, net of $107 million cash received, and the Sprint Settlement Agreement net payment of
$114 million which were partially offset by a net increase in sales of marketable investment securities of $1.072 billion
and a decline in capital expenditures of $437 million.
The decrease in net cash outflows from investing activities from 2009 to 2010 of $1.128 billion primarily resulted from
a net decrease in purchases of marketable investment securities, partially offset by an increase in capital expenditures
including the assignment of certain rights under a launch contract from EchoStar.
Cash flows from financing activities. Our financing activities generally include net proceeds related to the issuance of
long-term debt, cash used for the repurchase, redemption or payment of long-term debt and capital lease obligations,
dividends paid on our Class A and Class B common stock and repurchases of our Class A common stock. For the year
ended December 31, 2011, we reported net cash inflows from financing activities of $94 million. For the year ended
December 31, 2010, we reported net cash outflows from financing activities of $127 million. For the year ended
December 31, 2009, we reported net cash inflows from financing activities of $418 million.
The net cash inflows in 2011 primarily related to the proceeds of $1.973 billion from the issuance of our 6 3/4% Senior
Notes due 2021, net of deferred financing costs, partially offset by the redemption and repurchases of our 6 3/8%
Senior Notes due 2011 of $1.0 billion and our dividend payment of $893 million.
The net cash outflows in 2010 primarily related to the repurchases of our Class A common stock.
The net cash inflows in 2009 primarily related to the debt issuance of our 7 7/8% Senior Notes due 2019, partially
offset by our dividend payment of $894 million.
Other Liquidity Items
Subscriber Base
DISH lost approximately 166,000 net subscribers during the year ended December 31, 2011, compared to a gain of
approximately 33,000 net new subscribers during the same period in 2010. The change versus the prior year