Dish Network 2011 Annual Report Download - page 115
Download and view the complete annual report
Please find page 115 of the 2011 Dish Network annual report below. You can navigate through the pages in the report by either clicking on the pages listed below, or by using the keyword search tool below to find specific information within the annual report.-
 1
1 -
2
-
3
-
4
-
5
-
6
-
7
-
8
-
9
-
10
-
11
-
12
-
13
-
14
-
15
-
16
-
17
-
18
-
19
-
20
-
21
-
22
-
23
-
24
-
25
-
26
-
27
-
28
-
29
-
30
-
31
-
32
-
33
-
34
-
35
-
36
-
37
-
38
-
39
-
40
-
41
-
42
-
43
-
44
-
45
-
46
-
47
-
48
-
49
-
50
-
51
-
52
-
53
-
54
-
55
-
56
-
57
-
58
-
59
-
60
-
61
-
62
-
63
-
64
-
65
-
66
-
67
-
68
-
69
-
70
-
71
-
72
-
73
-
74
-
75
-
76
-
77
-
78
-
79
-
80
-
81
-
82
-
83
-
84
-
85
-
86
-
87
-
88
-
89
-
90
-
91
-
92
-
93
-
94
-
95
-
96
-
97
-
98
-
99
-
100
-
101
-
102
-
103
-
104
-
 105
105 -
 106
106 -
 107
107 -
 108
108 -
 109
109 -
 110
110 -
 111
111 -
 112
112 -
 113
113 -
 114
114 -
 115
115 -
 116
116 -
 117
117 -
 118
118 -
 119
119 -
 120
120 -
 121
121 -
 122
122 -
 123
123 -
 124
124 -
 125
125 -
126
-
127
-
128
-
129
-
130
-
131
-
132
-
133
-
134
-
135
-
136
-
137
-
138
-
139
-
140
-
141
-
142
-
143
-
144
-
145
-
146
-
147
-
148
-
149
-
150
-
151
-
152
-
153
-
154
-
155
-
156
-
157
-
158
-
159
-
160
-
161
-
162
-
163
-
164
 |
 |

DISH NETWORK CORPORATION
NOTES TO CONSOLIDATED FINANCIAL STATEMENTS - Continued
F-21
Marketable Investment Securities in a Loss Position
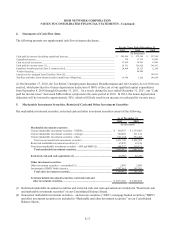
The following table reflects the length of time that the individual securities, accounted for as available-for-sale, have
been in an unrealized loss position, aggregated by investment category. As of December 31, 2011, the unrealized losses
on our investments in equity securities represent investments in broad-based indexes and several companies in the
telecommunications and technology industries. We are not aware of any specific factors which indicate the unrealized
losses in these investments are due to anything other than temporary market fluctuations. As of December 31, 2011 and
2010, the unrealized losses on our investments in debt securities primarily represent investments in auction rate and
mortgage backed securities. We do not intend to sell our investments in these debt securities before they recover or
mature, and it is more likely than not that we will hold these investments until that time. In addition, we are not aware of
any specific factors indicating that the underlying issuers of these debt securities would not be able to pay interest as it
becomes due or repay the principal at maturity. Therefore, we believe that these changes in the estimated fair values of
these marketable investment securities are related to temporary market fluctuations.
Debt
Securities
Equity
Securities Total
Debt
Securities
Equity
Securities Total
(In thousands)
Less than Six Months:
Fair value.................... 279,362$ 247,683$ 527,045$ 93,072$ 26,890$ 119,962$
Unrealized loss............ (1,259) (61,934) (63,193) (174) (8,429) (8,603)
Six to Nine Months:
Fair value.................... 233,708 - 233,708 26,182 - 26,182
Unrealized loss............ (2,369) - (2,369) (103) - (103)
Nine Months or More:
Fair value.................... 279,369 - 279,369 193,603 - 193,603
Unrealized loss............ (17,423) - (17,423) (13,661) - (13,661)
Total Fair Value........... 792,439$ 247,683$ 1,040,122$ 312,857$ 26,890$ 339,747$
As of December 31,
2011 2010
Investment Category Investment Category
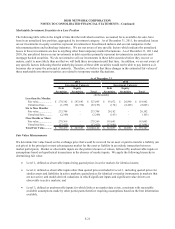
Fair Value Measurements
We determine fair value based on the exchange price that would be received for an asset or paid to transfer a liability (an
exit price) in the principal or most advantageous market for the asset or liability in an orderly transaction between
market participants. Market or observable inputs are the preferred source of values, followed by unobservable inputs or
assumptions based on hypothetical transactions in the absence of market inputs. We apply the following hierarchy in
determining fair value:
x Level 1, defined as observable inputs being quoted prices in active markets for identical assets;
x Level 2, defined as observable inputs other than quoted prices included in Level 1, including quoted prices for
similar assets and liabilities in active markets; quoted prices for identical or similar instruments in markets that
are not active; and model-derived valuations in which significant inputs and significant value drivers are
observable in active markets; and
x Level 3, defined as unobservable inputs for which little or no market data exists, consistent with reasonably
available assumptions made by other participants therefore requiring assumptions based on the best information
available.