Dish Network 2011 Annual Report Download - page 110
Download and view the complete annual report
Please find page 110 of the 2011 Dish Network annual report below. You can navigate through the pages in the report by either clicking on the pages listed below, or by using the keyword search tool below to find specific information within the annual report.-
 1
1 -
2
-
3
-
4
-
5
-
6
-
7
-
8
-
9
-
10
-
11
-
12
-
13
-
14
-
15
-
16
-
17
-
18
-
19
-
20
-
21
-
22
-
23
-
24
-
25
-
26
-
27
-
28
-
29
-
30
-
31
-
32
-
33
-
34
-
35
-
36
-
37
-
38
-
39
-
40
-
41
-
42
-
43
-
44
-
45
-
46
-
47
-
48
-
49
-
50
-
51
-
52
-
53
-
54
-
55
-
56
-
57
-
58
-
59
-
60
-
61
-
62
-
63
-
64
-
65
-
66
-
67
-
68
-
69
-
70
-
71
-
72
-
73
-
74
-
75
-
76
-
77
-
78
-
79
-
80
-
81
-
82
-
83
-
84
-
85
-
86
-
87
-
88
-
89
-
90
-
91
-
92
-
93
-
94
-
95
-
96
-
97
-
98
-
99
-
 100
100 -
 101
101 -
 102
102 -
 103
103 -
 104
104 -
 105
105 -
 106
106 -
 107
107 -
 108
108 -
 109
109 -
 110
110 -
 111
111 -
 112
112 -
 113
113 -
 114
114 -
 115
115 -
 116
116 -
 117
117 -
 118
118 -
 119
119 -
 120
120 -
121
-
122
-
123
-
124
-
125
-
126
-
127
-
128
-
129
-
130
-
131
-
132
-
133
-
134
-
135
-
136
-
137
-
138
-
139
-
140
-
141
-
142
-
143
-
144
-
145
-
146
-
147
-
148
-
149
-
150
-
151
-
152
-
153
-
154
-
155
-
156
-
157
-
158
-
159
-
160
-
161
-
162
-
163
-
164
 |
 |

DISH NETWORK CORPORATION
NOTES TO CONSOLIDATED FINANCIAL STATEMENTS - Continued
F-16
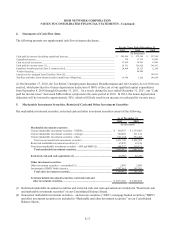
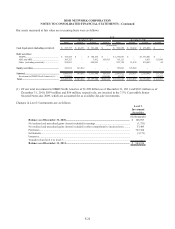
3. Basic and Diluted Net Income (Loss) Per Share
We present both basic earnings per share (“EPS”) and diluted EPS. Basic EPS excludes potential dilution and is
computed by dividing “Net income (loss) attributable to DISH Network” by the weighted-average number of common
shares outstanding for the period. Diluted EPS reflects the potential dilution that could occur if stock awards were
exercised and convertible securities were converted to common stock.
The potential dilution from our subordinated notes convertible into common stock was computed using the “if converted
method.” The potential dilution from stock awards was computed using the treasury stock method based on the average
market value of our Class A common stock. The following table presents earnings per share amounts for all periods and
the basic and diluted weighted-average shares outstanding used in the calculation.
2011 2010 2009
Basic net income (loss) attributable to DISH Network................................................................. $ 1,515,907 $ 984,729 $ 635,545
Interest on dilutive subordinated convertible notes, net of related tax effect................................ - - 390
Diluted net income (loss) attributable to DISH Network.............................................................. $ 1,515,907 $ 984,729 $ 635,935
Wei
g
hted-avera
g
e common shares outstandin
g
- Class A and B common stock:
Basic............................................................................................................................................. 445,434 445,865 446,874
Dilutive impact of stock awards outstanding................................................................................ 1,431 732 1,320
Dilutive impact of subordinated notes convertible into common shares....................................... - - 402
Diluted.......................................................................................................................................... 446,865 446,597 448,596
Earnin
g
s
p
er share - Class A and B common stock:
Basic net income (loss) per share attributable to DISH Network................................................. $ 3.40 $ 2.21 $ 1.42
Diluted net income (loss) per share attributable to DISH Network.............................................. $ 3.39 $ 2.20 $ 1.42
Shares of Class A common stock issuable u
p
on conversion of:
3% Convertible Subordinated Note due 2011 (repaid during fourth quarter 2009)................... - - 482
For the Years Ended December 31,
(In thousands, except per share amounts)
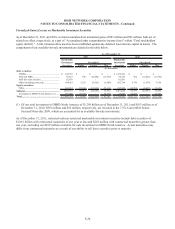
As of December 31, 2011, 2010 and 2009, there were stock awards to purchase 5.0 million, 10.8 million and 8.9 million
shares, respectively, of Class A common stock outstanding, not included in the weighted-average common shares
outstanding above, as their effect is antidilutive.
Vesting of options and rights to acquire shares of our Class A common stock granted pursuant to our performance based
stock incentive plans (“Restricted Performance Units”) is contingent upon meeting certain goals which are not yet
probable of being achieved. As a consequence, the following are also not included in the diluted EPS calculation.
2011 2010 2009
Performance based options.......................... 9,549 10,979 9,363
Restricted Performance Units and other....... 1,285 1,494 1,096
Total......................................................... 10,834 12,473 10,459
As of December 31,
(In thousands)