Dish Network 2011 Annual Report Download - page 66
Download and view the complete annual report
Please find page 66 of the 2011 Dish Network annual report below. You can navigate through the pages in the report by either clicking on the pages listed below, or by using the keyword search tool below to find specific information within the annual report.-
 1
1 -
2
-
3
-
4
-
5
-
6
-
7
-
8
-
9
-
10
-
11
-
12
-
13
-
14
-
15
-
16
-
17
-
18
-
19
-
20
-
21
-
22
-
23
-
24
-
25
-
26
-
27
-
28
-
29
-
30
-
31
-
32
-
33
-
34
-
35
-
36
-
37
-
38
-
39
-
40
-
41
-
42
-
43
-
44
-
45
-
46
-
47
-
48
-
49
-
50
-
51
-
52
-
53
-
54
-
55
-
 56
56 -
 57
57 -
 58
58 -
 59
59 -
 60
60 -
 61
61 -
 62
62 -
 63
63 -
 64
64 -
 65
65 -
 66
66 -
 67
67 -
 68
68 -
 69
69 -
 70
70 -
 71
71 -
 72
72 -
 73
73 -
 74
74 -
 75
75 -
 76
76 -
77
-
78
-
79
-
80
-
81
-
82
-
83
-
84
-
85
-
86
-
87
-
88
-
89
-
90
-
91
-
92
-
93
-
94
-
95
-
96
-
97
-
98
-
99
-
100
-
101
-
102
-
103
-
104
-
105
-
106
-
107
-
108
-
109
-
110
-
111
-
112
-
113
-
114
-
115
-
116
-
117
-
118
-
119
-
120
-
121
-
122
-
123
-
124
-
125
-
126
-
127
-
128
-
129
-
130
-
131
-
132
-
133
-
134
-
135
-
136
-
137
-
138
-
139
-
140
-
141
-
142
-
143
-
144
-
145
-
146
-
147
-
148
-
149
-
150
-
151
-
152
-
153
-
154
-
155
-
156
-
157
-
158
-
159
-
160
-
161
-
162
-
163
-
164
 |
 |
Item 7. MANAGEMENT’S DISCUSSION AND ANALYSIS OF FINANCIAL CONDITION AND
RESULTS OF OPERATIONS - Continued
56
56
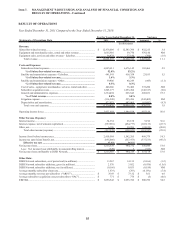
DISH subscribers. DISH lost approximately 166,000 net subscribers during the year ended December 31, 2011,
compared to a gain of approximately 33,000 net new subscribers during the same period in 2010. The change versus
the prior year primarily resulted from a decline in gross new subscriber activations. During the year ended
December 31, 2011, DISH added approximately 2.576 million gross new subscribers compared to approximately
3.052 million gross new subscribers during the same period in 2010, a decrease of 15.6%.
Our gross activations and net subscriber additions were negatively impacted during the year ended December 31,
2011 compared to the same period in 2010 as a result of increased competitive pressures, including aggressive
marketing and the effectiveness of certain competitors’ promotional offers, which included an increased level of
programming discounts. In addition, telecommunications companies continue to grow their respective customer
bases. Our gross activations and net subscriber additions continue to be adversely affected during the year ended
December 31, 2011 by sustained economic weakness and uncertainty, including, among other things, the weak
housing market in the United States combined with lower discretionary spending.
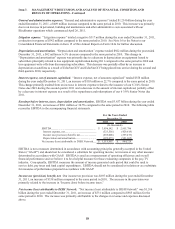
Our average monthly subscriber churn rate for the year ended December 31, 2011 was 1.63%, compared to 1.76%
for the same period in 2010. While churn improved compared to the same period in 2010, churn continues to be
adversely affected by the increased competitive pressures discussed above. In general, our churn rate is impacted by
the quality of subscribers acquired in past quarters, our ability to provide outstanding customer service, and our
ability to control piracy.
We have not always met our own standards for performing high-quality installations, effectively resolving
subscriber issues when they arise, answering subscriber calls in an acceptable timeframe, effectively communicating
with our subscriber base, reducing calls driven by the complexity of our business, improving the reliability of certain
systems and subscriber equipment, and aligning the interests of certain third party retailers and installers to provide
high-quality service. Most of these factors have affected both gross new subscriber activations as well as existing
subscriber churn. Our future gross new subscriber activations and subscriber churn may be negatively impacted by
these factors, which could in turn adversely affect our revenue growth.
Subscriber-related revenue. DISH “Subscriber-related revenue” totaled $12.976 billion for the year ended December
31, 2011, an increase of $432 million or 3.4% compared to the same period in 2010. This change was primarily
related to the increase in “ARPU” discussed below.
ARPU. “Average monthly revenue per subscriber” was $76.93 during the year ended December 31, 2011 versus
$73.32 during the same period in 2010. The $3.61 or 4.9% increase in ARPU was primarily attributable to price
increases during the past year, higher hardware related revenue and fees earned from our in-home service operations,
partially offset by decreases in premium and pay per view revenue.
Equipment and merchandise sales, rental and other revenue. “Equipment and merchandise sales, rental and other
revenue” totaled $1.036 billion for the year ended December 31, 2011, an increase of $976 million compared to the
same period in 2010. This increase was primarily driven by revenue from the rental of movies and video games, the
sale of previously rented titles, and other merchandise sold to customers including movies, video games and other
accessories related to our Blockbuster operations which commenced April 26, 2011.
Subscriber-related expenses. “Subscriber-related expenses” totaled $6.846 billion during the year ended December
31, 2011, an increase of $169 million or 2.5% compared to the same period in 2010. The increase in “Subscriber-
related expenses” was primarily attributable to higher programming costs and an increase in customer retention
expense, partially offset by reduced costs related to our call centers. The increase in programming costs was driven by
rate increases in certain of our programming contracts, including the renewal of certain contracts at higher rates.
“Subscriber-related expenses” represented 52.8% and 53.2% of “Subscriber-related revenue” during the year ended
December 31, 2011 and 2010, respectively. The improvement in this expense to revenue ratio primarily resulted from
an increase in “Subscriber-related revenue,” partially offset by higher programming costs, discussed above.