Dish Network 2011 Annual Report Download - page 111
Download and view the complete annual report
Please find page 111 of the 2011 Dish Network annual report below. You can navigate through the pages in the report by either clicking on the pages listed below, or by using the keyword search tool below to find specific information within the annual report.-
 1
1 -
2
-
3
-
4
-
5
-
6
-
7
-
8
-
9
-
10
-
11
-
12
-
13
-
14
-
15
-
16
-
17
-
18
-
19
-
20
-
21
-
22
-
23
-
24
-
25
-
26
-
27
-
28
-
29
-
30
-
31
-
32
-
33
-
34
-
35
-
36
-
37
-
38
-
39
-
40
-
41
-
42
-
43
-
44
-
45
-
46
-
47
-
48
-
49
-
50
-
51
-
52
-
53
-
54
-
55
-
56
-
57
-
58
-
59
-
60
-
61
-
62
-
63
-
64
-
65
-
66
-
67
-
68
-
69
-
70
-
71
-
72
-
73
-
74
-
75
-
76
-
77
-
78
-
79
-
80
-
81
-
82
-
83
-
84
-
85
-
86
-
87
-
88
-
89
-
90
-
91
-
92
-
93
-
94
-
95
-
96
-
97
-
98
-
99
-
100
-
 101
101 -
 102
102 -
 103
103 -
 104
104 -
 105
105 -
 106
106 -
 107
107 -
 108
108 -
 109
109 -
 110
110 -
 111
111 -
 112
112 -
 113
113 -
 114
114 -
 115
115 -
 116
116 -
 117
117 -
 118
118 -
 119
119 -
 120
120 -
 121
121 -
122
-
123
-
124
-
125
-
126
-
127
-
128
-
129
-
130
-
131
-
132
-
133
-
134
-
135
-
136
-
137
-
138
-
139
-
140
-
141
-
142
-
143
-
144
-
145
-
146
-
147
-
148
-
149
-
150
-
151
-
152
-
153
-
154
-
155
-
156
-
157
-
158
-
159
-
160
-
161
-
162
-
163
-
164
 |
 |

DISH NETWORK CORPORATION
NOTES TO CONSOLIDATED FINANCIAL STATEMENTS - Continued
F-17
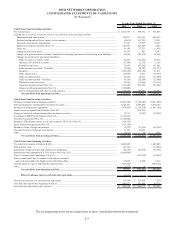
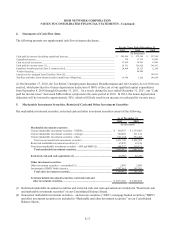
4. Statements of Cash Flow Data
The following presents our supplemental cash flow statement disclosure.
2011 2010 2009
Cash paid for interest (including capitalized interest)............................................................................ $ 545,406 $ 472,586 $ 357,990
Capitalized interest................................................................................................................................ 120 17,139 19,685
Cash received for interest...................................................................................................................... 37,502 36,853 19,489
Cash paid for income taxes (1).............................................................................................................. 38,761 525,028 348,931
Employee benefits paid in Class A common stock................................................................................ 24,804 29,127 12,198
Vendor financing................................................................................................................................... - 40,000 -
Launch service assigned from EchoStar (Note 20)................................................................................ - - 102,913
Satellites and other assets financed under capital lease obligations....................................................... 10,548 5,282 140,109
For the Years Ended December 31,
(In thousands)
(1) On December 17, 2010, the Tax Relief, Unemployment Insurance Reauthorization and Job Creation Act of 2010 was
enacted, which provides for a bonus depreciation deduction of 100% of the cost of our qualified capital expenditures
from September 8, 2010 through December 31, 2011. As a result, during the year ended December 31, 2011, our “Cash
paid for income taxes” decreased $486 million compared to the same period in 2010. In 2012, the bonus depreciation
deduction will be lowered to approximately 50%, which will likely result in an increase in cash paid for income taxes.
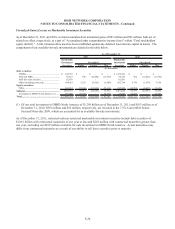
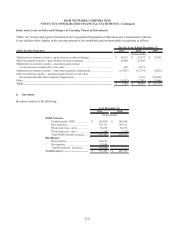
5. Marketable Investment Securities, Restricted Cash and Other Investment Securities
Our marketable investment securities, restricted cash and other investment securities consist of the following:
As of December 31,
2011 2010
(In thousands)
Marketable investment securities:
Current marketable investment securities - VRDNs............................................. 160,555$ 1,334,081$
Current marketable investment securities - strategic............................................. 360,052 211,141
Current marketable investment securities - other.................................................. 911,138 754,483
Total current marketable investment securities.............................................. 1,431,745 2,299,705
Restricted marketable investment securities (1).................................................... 65,843 62,196
Noncurrent marketable investment securities - ARS and MBS (2)....................... 109,327 119,121
Total marketable investment securities........................................................ 1,606,915 2,481,022
Restricted cash and cash equivalents (1)........................................................... 66,592 82,241
Other investment securities:
Other investment securities - cost method (2)....................................................... 2,805 2,805
Investment in DBSD North America.................................................................... 1,297,614 102,591
Total other investment securities.................................................................. 1,300,419 105,396
Total marketable investment securities, restricted cash and
other investment securities.............................................................................. 2,973,926$ 2,668,659$
(1) Restricted marketable investment securities and restricted cash and cash equivalents are included in “Restricted cash
and marketable investment securities” on our Consolidated Balance Sheets.
(2) Noncurrent marketable investment securities – auction rate securities (“ARS”), mortgage backed securities (“MBS”)
and other investment securities are included in “Marketable and other investment securities” on our Consolidated
Balance Sheets.