Dish Network 2011 Annual Report Download - page 114
Download and view the complete annual report
Please find page 114 of the 2011 Dish Network annual report below. You can navigate through the pages in the report by either clicking on the pages listed below, or by using the keyword search tool below to find specific information within the annual report.-
 1
1 -
2
-
3
-
4
-
5
-
6
-
7
-
8
-
9
-
10
-
11
-
12
-
13
-
14
-
15
-
16
-
17
-
18
-
19
-
20
-
21
-
22
-
23
-
24
-
25
-
26
-
27
-
28
-
29
-
30
-
31
-
32
-
33
-
34
-
35
-
36
-
37
-
38
-
39
-
40
-
41
-
42
-
43
-
44
-
45
-
46
-
47
-
48
-
49
-
50
-
51
-
52
-
53
-
54
-
55
-
56
-
57
-
58
-
59
-
60
-
61
-
62
-
63
-
64
-
65
-
66
-
67
-
68
-
69
-
70
-
71
-
72
-
73
-
74
-
75
-
76
-
77
-
78
-
79
-
80
-
81
-
82
-
83
-
84
-
85
-
86
-
87
-
88
-
89
-
90
-
91
-
92
-
93
-
94
-
95
-
96
-
97
-
98
-
99
-
100
-
101
-
102
-
103
-
 104
104 -
 105
105 -
 106
106 -
 107
107 -
 108
108 -
 109
109 -
 110
110 -
 111
111 -
 112
112 -
 113
113 -
 114
114 -
 115
115 -
 116
116 -
 117
117 -
 118
118 -
 119
119 -
 120
120 -
 121
121 -
 122
122 -
 123
123 -
 124
124 -
125
-
126
-
127
-
128
-
129
-
130
-
131
-
132
-
133
-
134
-
135
-
136
-
137
-
138
-
139
-
140
-
141
-
142
-
143
-
144
-
145
-
146
-
147
-
148
-
149
-
150
-
151
-
152
-
153
-
154
-
155
-
156
-
157
-
158
-
159
-
160
-
161
-
162
-
163
-
164
 |
 |

DISH NETWORK CORPORATION
NOTES TO CONSOLIDATED FINANCIAL STATEMENTS - Continued
F-20
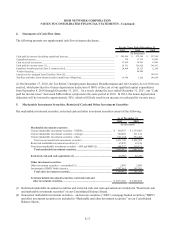
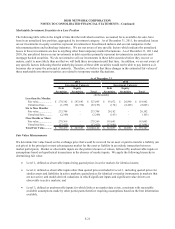
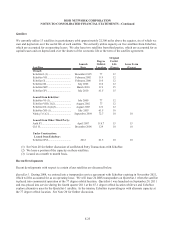
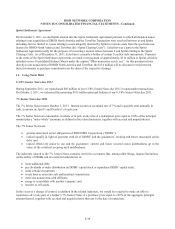
Unrealized Gains (Losses) on Marketable Investment Securities
As of December 31, 2011 and 2010, we had accumulated net unrealized gains of $91 million and $93 million, both net of
related tax effect, respectively, as a part of “Accumulated other comprehensive income (loss)” within “Total stockholders’
equity (deficit).” A full valuation allowance has been established against any deferred taxes that are capital in nature. The
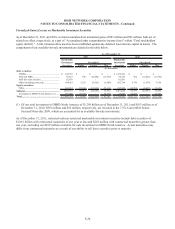
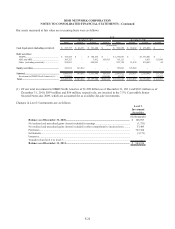
components of our available-for-sale investments are detailed in the table below.
Marketable Marketable
Investment Investment
Securities Gains Losses Net Securities Gains Losses Net
Debt securities:
VRDNs.......................................................... 160,555$ -$ -$ -$ 1,334,081$ -$ -$ -$
ARS and MBS............................................... 46,657 848 (14,486) (13,638) 56,430 902 (12,262) (11,360)
ARS fair value election................................. 62,670 - - - 62,691 - - -
Other (including restricted)........................... 994,021 5,525 (6,565) (1,040) 832,798 9,330 (1,676) 7,654
Equity securities:
Other............................................................. 343,012 89,044 (61,934) 27,110 195,022 82,565 (8,429) 74,136
Subtotal............................................................ 1,606,915 95,417 (82,985) 12,432 2,481,022 92,797 (22,367) 70,430
Investment in DBSD North America (1)....... 839,009 78,749 - 78,749 55,823 22,926 - 22,926
Total................................................................. 2,445,924$ 174,166$ (82,985)$ 91,181$ 2,536,845$ 115,723$ (22,367)$ 93,356$
As of December 31,
(In thousands)
Unrealized
2011
Unrealized
2010
(1) Of our total investment in DBSD North America of $1.298 billion as of December 31, 2011 and $103 million as of
December 31, 2010, $839 million and $56 million, respectively, are invested in the 7.5% Convertible Senior
Secured Notes due 2009, which are accounted for as available-for-sale investments.
As of December 31, 2011, restricted and non-restricted marketable investment securities include debt securities of
$1.061 billion with contractual maturities of one year or less and $203 million with contractual maturities greater than
one year, excluding our $839 million available-for-sale investment in DBSD North America. Actual maturities may
differ from contractual maturities as a result of our ability to sell these securities prior to maturity.