Dish Network 2011 Annual Report Download - page 58
Download and view the complete annual report
Please find page 58 of the 2011 Dish Network annual report below. You can navigate through the pages in the report by either clicking on the pages listed below, or by using the keyword search tool below to find specific information within the annual report.-
 1
1 -
2
-
3
-
4
-
5
-
6
-
7
-
8
-
9
-
10
-
11
-
12
-
13
-
14
-
15
-
16
-
17
-
18
-
19
-
20
-
21
-
22
-
23
-
24
-
25
-
26
-
27
-
28
-
29
-
30
-
31
-
32
-
33
-
34
-
35
-
36
-
37
-
38
-
39
-
40
-
41
-
42
-
43
-
44
-
45
-
46
-
47
-
 48
48 -
 49
49 -
 50
50 -
 51
51 -
 52
52 -
 53
53 -
 54
54 -
 55
55 -
 56
56 -
 57
57 -
 58
58 -
 59
59 -
 60
60 -
 61
61 -
 62
62 -
 63
63 -
 64
64 -
 65
65 -
 66
66 -
 67
67 -
 68
68 -
69
-
70
-
71
-
72
-
73
-
74
-
75
-
76
-
77
-
78
-
79
-
80
-
81
-
82
-
83
-
84
-
85
-
86
-
87
-
88
-
89
-
90
-
91
-
92
-
93
-
94
-
95
-
96
-
97
-
98
-
99
-
100
-
101
-
102
-
103
-
104
-
105
-
106
-
107
-
108
-
109
-
110
-
111
-
112
-
113
-
114
-
115
-
116
-
117
-
118
-
119
-
120
-
121
-
122
-
123
-
124
-
125
-
126
-
127
-
128
-
129
-
130
-
131
-
132
-
133
-
134
-
135
-
136
-
137
-
138
-
139
-
140
-
141
-
142
-
143
-
144
-
145
-
146
-
147
-
148
-
149
-
150
-
151
-
152
-
153
-
154
-
155
-
156
-
157
-
158
-
159
-
160
-
161
-
162
-
163
-
164
 |
 |
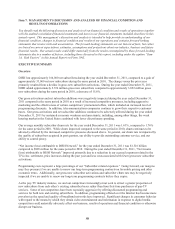
Item 7. MANAGEMENT’S DISCUSSION AND ANALYSIS OF FINANCIAL CONDITION AND
RESULTS OF OPERATIONS
48
48
You should read the following discussion and analysis of our financial condition and results of operations together
with the audited consolidated financial statements and notes to our financial statements included elsewhere in this
annual report. This management’s discussion and analysis is intended to help provide an understanding of our
financial condition, changes in financial condition and results of our operations and contains forward-looking
statements that involve risks and uncertainties. The forward-looking statements are not historical facts, but rather
are based on current expectations, estimates, assumptions and projections about our industry, business and future
financial results. Our actual results could differ materially from the results contemplated by these forward-looking
statements due to a number of factors, including those discussed in this report, including under the caption “Item
1A. Risk Factors” in this Annual Report on Form 10-K.
EXECUTIVE SUMMARY
Overview
DISH lost approximately 166,000 net subscribers during the year ended December 31, 2011, compared to a gain of
approximately 33,000 net new subscribers during the same period in 2010. The change versus the prior year
primarily resulted from a decline in gross new subscriber activations. During the year ended December 31, 2011,
DISH added approximately 2.576 million gross new subscribers compared to approximately 3.052 million gross
new subscribers during the same period in 2010, a decrease of 15.6%.
Our gross activations and net subscriber additions were negatively impacted during the year ended December 31,
2011 compared to the same period in 2010 as a result of increased competitive pressures, including aggressive
marketing and the effectiveness of certain competitors’ promotional offers, which included an increased level of
programming discounts. In addition, telecommunications companies continue to grow their respective customer
bases. Our gross activations and net subscriber additions continue to be adversely affected during the year ended
December 31, 2011 by sustained economic weakness and uncertainty, including, among other things, the weak
housing market in the United States combined with lower discretionary spending.
Our average monthly subscriber churn rate for the year ended December 31, 2011 was 1.63%, compared to 1.76%
for the same period in 2010. While churn improved compared to the same period in 2010, churn continues to be
adversely affected by the increased competitive pressures discussed above. In general, our churn rate is impacted by
the quality of subscribers acquired in past quarters, our ability to provide outstanding customer service, and our
ability to control piracy.
“Net income (loss) attributable to DISH Network” for the year ended December 31, 2011 was $1.516 billion
compared to $985 million for the same period in 2010. During the year ended December 31, 2011, “Net income
(loss) attributable to DISH Network” improved primarily due to a reduction in our accrued expenses related to the
TiVo Inc. settlement, price increases during the past year and less costs associated with fewer gross new subscriber
activations.
Programming costs represent a large percentage of our “Subscriber-related expenses.” Going forward, our margins
may face pressure if we are unable to renew our long-term programming contracts on favorable pricing and other
economic terms. Additionally, our gross new subscriber activations and subscriber churn rate may be negatively
impacted if we are unable to renew our long-term programming contracts before they expire.
As the pay-TV industry matures, we and our competitors increasingly must seek to attract a greater proportion of
new subscribers from each other’s existing subscriber bases rather than from first-time purchasers of pay-TV
services. Some of our competitors have been especially aggressive by offering discounted programming and
services for both new and existing subscribers. In addition, programming offered over the Internet has become more
prevalent as the speed and quality of broadband networks have improved. Significant changes in consumer behavior
with regard to the means by which they obtain video entertainment and information in response to digital media
competition could materially adversely affect our business, results of operations and financial condition or otherwise
disrupt our business.