Dish Network 2000 Annual Report Download - page 84
Download and view the complete annual report
Please find page 84 of the 2000 Dish Network annual report below. You can navigate through the pages in the report by either clicking on the pages listed below, or by using the keyword search tool below to find specific information within the annual report.-
 1
1 -
2
-
3
-
4
-
5
-
6
-
7
-
8
-
9
-
10
-
11
-
12
-
13
-
14
-
15
-
16
-
17
-
18
-
19
-
20
-
21
-
22
-
23
-
24
-
25
-
26
-
27
-
28
-
29
-
30
-
31
-
32
-
33
-
34
-
35
-
36
-
37
-
38
-
39
-
40
-
41
-
42
-
43
-
44
-
45
-
46
-
47
-
48
-
49
-
50
-
51
-
52
-
53
-
54
-
55
-
56
-
57
-
58
-
59
-
60
-
61
-
62
-
63
-
64
-
65
-
66
-
67
-
68
-
69
-
70
-
71
-
72
-
73
-
 74
74 -
 75
75 -
 76
76 -
 77
77 -
 78
78 -
 79
79 -
 80
80 -
 81
81 -
 82
82 -
 83
83 -
 84
84 -
 85
85 -
 86
86
 |
 |

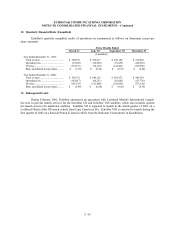
ECHOSTAR COMMUNICATIONS CORPORATION
NOTES TO CONSOLIDATED FINANCIAL STATEMENTS – Continued
F–33
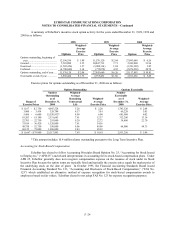
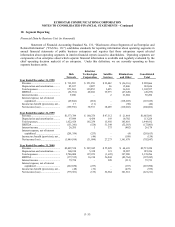
10. Segment Reporting
Financial Data by Business Unit (in thousands)
Statement of Financial Accounting Standard No. 131, “Disclosures About Segments of an Enterprise and
Related Information” (“FAS No. 131”) establishes standards for reporting information about operating segments in
annual financial statements of public business enterprises and requires that those enterprises report selected
information about operating segments in interim financial reports issued to shareholders. Operating segments are
components of an enterprise about which separate financial information is available and regularly evaluated by the
chief operating decision maker(s) of an enterprise. Under this definition, we are currently operating as three
separate business units.
Dish
Network
EchoStar
Technologies
Corporation
Satellite
Services
Eliminations
and Other
Consolidated
Total
Year Ended December 31, 1998
Revenue.......................................... $ 733,382 $ 251,958 $ 23,442 $ (26,116) $ 982,666
Depreciation and amortization ......... 85,107 2,097 26 15,406 102,636
Total expenses................................. 871,269 193,852 3,495 36,941 1,105,557
EBITDA ......................................... (52,781) 60,202 19,973 (47,649) (20,255)
Interest income................................ 9,280 – 2 21,004 30,286
Interest expense, net of interest
capitalized ................................... (49,042) (282) –(118,205) (167,529)
Income tax benefit (provision), net... 17 (11) –(50) (44)
Net income (loss) ............................ (199,356) 30,333 18,409 (110,268) (260,882)
Year Ended December 31, 1999
Revenue.......................................... $1,373,789 $ 160,276 $ 47,312 $ 21,464 $1,602,841
Depreciation and amortization ......... 97,899 4,434 193 10,702 113,228
Total expenses................................. 1,622,928 165,238 15,956 145,810 1,949,932
EBITDA ......................................... (151,241) (528) 31,549 (52,583) (172,803)
Interest income................................ 26,205 1375 (402) 26,179
Interest expense, net of interest
capitalized ................................... (201,356) (253) –(4) (201,613)
Income tax benefit (provision), net... –(46) –(108) (154)
Net income (loss) ............................ (1,949,914) (31,884) 27,273 1,161,678 (792,847)
Year Ended December 31, 2000
Revenue.......................................... $2,407,554 $ 207,945 $ 55,028 $ 44,693 $2,715,220
Depreciation and amortization ......... 160,910 5,338 121 18,987 185,356
Total expenses................................. 2,746,000 197,073 (1,695) 197,908 3,139,286
EBITDA ......................................... (177,535) 16,210 56,844 (82,764) (187,245)
Interest income................................ 79,724 –220 (211) 79,733
Interest expense, net of interest
capitalized ................................... (267,650) (233) –(107) (267,990)
Income tax benefit (provision), net... (48) (32) –(475) (555)
Net income (loss) ............................ (775,581) (155) 52,964 101,561 (621,211)