Dish Network 2000 Annual Report Download - page 30
Download and view the complete annual report
Please find page 30 of the 2000 Dish Network annual report below. You can navigate through the pages in the report by either clicking on the pages listed below, or by using the keyword search tool below to find specific information within the annual report.-
 1
1 -
2
-
3
-
4
-
5
-
6
-
7
-
8
-
9
-
10
-
11
-
12
-
13
-
14
-
15
-
16
-
17
-
18
-
19
-
 20
20 -
 21
21 -
 22
22 -
 23
23 -
 24
24 -
 25
25 -
 26
26 -
 27
27 -
 28
28 -
 29
29 -
 30
30 -
 31
31 -
 32
32 -
 33
33 -
 34
34 -
 35
35 -
 36
36 -
 37
37 -
 38
38 -
 39
39 -
 40
40 -
41
-
42
-
43
-
44
-
45
-
46
-
47
-
48
-
49
-
50
-
51
-
52
-
53
-
54
-
55
-
56
-
57
-
58
-
59
-
60
-
61
-
62
-
63
-
64
-
65
-
66
-
67
-
68
-
69
-
70
-
71
-
72
-
73
-
74
-
75
-
76
-
77
-
78
-
79
-
80
-
81
-
82
-
83
-
84
-
85
-
86
 |
 |

28
Item 6. SELECTED FINANCIAL DATA
The selected consolidated financial data as of and for each of the five years ended December 31, 2000 have
been derived from, and are qualified by reference to our Consolidated Financial Statements which have been audited by
Arthur Andersen LLP, independent public accountants. This data should be read in conjunction with our Consolidated
Financial Statements and related Notes thereto for the three years ended December 31, 2000, and “Management’s
Discussion and Analysis of Financial Condition and Results of Operations” included elsewhere in this report.
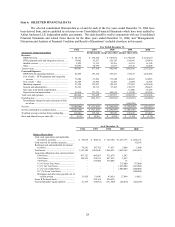
Year Ended December 31,
1996 1997 1998 1999 2000
Statements of Operations Data (In thousands, except subscribers and per share data)
Revenue:
DISH Network........................................................ $ 60,132 $ 344,250 $ 683,032 $ 1,352,603 $ 2,352,237
DTH equipment sales and integration services ...... 78,062 91,637 256,193 184,041 259,830
Satellite services...................................................... 5,822 11,135 22,366 41,071 61,105
Other........................................................................ 54,885 30,396 21,075 25,126 42,048
Total revenue ............................................................. 198,901 477,418 982,666 1,602,841 2,715,220
Costs and Expenses:
DISH Network operating expenses ........................ 42,456 193,274 395,411 732,675 1,265,445
Cost of sales – DTH equipment and integration
services ............................................................... 76,384 61,992 173,388 148,427 194,963
Cost of sales – other................................................ 42,349 23,909 16,496 17,084 32,992
Marketing expenses ................................................ 51,520 179,923 320,521 727,061 1,158,640
General and administrative ..................................... 52,123 69,315 97,105 150,397 250,425
Non-cash, stock-based compensation..................... –––61,060 51,465
Depreciation and amortization................................ 43,414 173,276 102,636 113,228 185,356
Total costs and expenses............................................ 308,246 701,689 1,105,557 1,949,932 3,139,286
Operating loss ............................................................ (109,345) (224,271) (122,891) (347,091) (424,066)
Extraordinary charge for early retirement of debt,
net of tax............................................................. –––(268,999) –
Net loss....................................................................... $ (100,986) $ (312,825) $ (260,882) $ (792,847) (621,211)
Net loss attributable to common shares..................... $ (102,190) $ (321,267) $ (296,097) $ (800,100) (622,357)
Weighted-average common shares outstanding........ 324,384 335,344 359,856 416,476 471,023
Basic and diluted loss per share (1)........................... $ (0.32) $ (0.96) $ (0.82) $ (1.92) $ (1.32)
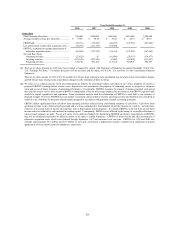
As of December 31,
1996 1997 1998 1999 2000
Balance Sheets Data
Cash, cash equivalents and marketable
investment securities ................................. $ 58,038 $ 420,514 $ 324,100 $ 1,254,175 $ 1,464,175
Cash reserved for satellite insurance ............. – – – – 82,393
Restricted cash and marketable investment
securities.................................................... 79,291 187,762 77,657 3,000 3,000
Total assets..................................................... 1,141,380 1,805,646 1,806,852 3,898,189 4,665,950
Long-term obligations (less current portion):
1994 Notes ................................................ 437,127 499,863 571,674 1,503 –
1996 Notes ................................................ 386,165 438,512 497,955 1,097 –
1997 Notes ................................................ –375,000 375,000 15 –
9 1/4% Seven Year Notes .......................... –––375,000 375,000
9 3/8% Ten Year Notes .............................. –––1,625,000 1,625,000
4 7/8% Convertible Notes .......................... –––1,000,000 1,000,000
10 3/8% Seven Year Notes......................... – – – – 1,000,000
Mortgages and other notes payable, net of
current portion ...................................... 51,428 51,846 43,450 27,990 14,812
Series B Preferred Stock................................ –199,164 226,038 – –
Total stockholders’ equity (deficit) ............... 61,197 (88,961)
(371,540)
(48,418) (628,268)