Dish Network 2000 Annual Report Download - page 38
Download and view the complete annual report
Please find page 38 of the 2000 Dish Network annual report below. You can navigate through the pages in the report by either clicking on the pages listed below, or by using the keyword search tool below to find specific information within the annual report.36
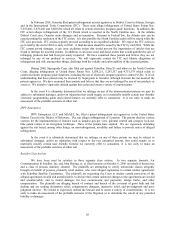
Network. Customer service center and other expenses totaled 9% of subscription television services revenue during
1999, as compared to 11% during the same period in 1998.
Satellite and transmission expenses include expenses associated with the operation of our digital broadcast
center, contracted satellite telemetry, tracking and control services, and satellite in-orbit insurance. Satellite and
transmission expenses totaled $41 million during 1999, a $15 million increase compared to the same period in 1998.
This increase resulted from higher satellite and other digital broadcast center operating expenses due to an increase
in the number of operational satellites. Satellite and transmission expenses totaled 3% and 4% of subscription
television services revenue during the year ended December 31, 1999 and 1998, respectively.
Cost of sales - DTH equipment and Integration Services. Cost of sales - DTH equipment and integration
services totaled $148 million during 1999, a decrease of $25 million compared to the same period in 1998. Cost of
sales - DTH equipment and integration services principally includes costs associated with digital set-top boxes and
related components sold to international DTH operators and DBS accessories. Cost of sales - DTH equipment and
integration services represented 81% and 68% of DTH equipment revenue, during the years ended December 31,
1999 and 1998, respectively. The lower margin was principally attributable to a $16.6 million loss provision
primarily for component parts and purchase commitments related to our first generation model 7100 set-top boxes,
for which production has been suspended in favor of our second generation model 7200 set-top boxes. The write-off
partially offset the expected decrease in cost of sales - DTH equipment and integration services attributable to a
decrease in demand combined with increased competition.
Marketing Expenses. Marketing expenses totaled $727 million during 1999, an increase of $406 million
compared to the same period in 1998. The increase in marketing expenses was primarily attributable to an increase
in subscriber promotion subsidies. Subscriber promotion subsidies – promotional DTH equipment includes the cost
related to EchoStar receiver systems distributed to retailers and other distributors of our equipment. Subscriber
promotion subsidies - other includes net costs related to our free installation promotion and other promotional
incentives. Advertising and other expenses totaled $65 million and $48 million during the years ended December
31, 1999 and 1998, respectively.
During 1999, our total subscriber acquisition costs, inclusive of acquisition marketing expenses, totaled
approximately $729 million, or approximately $385 per new subscriber activation. Comparatively, our subscriber
acquisition costs during the year ended December 31, 1998, inclusive of acquisition marketing expenses and
deferred subscriber acquisition costs, totaled $317 million, or approximately $285 per new subscriber activation.
The increase in our subscriber acquisition costs, on a per new subscriber activation basis, principally resulted from
the introduction of several aggressive marketing promotions to acquire new subscribers.
General and Administrative Expenses. General and administrative expenses totaled $150 million during
1999, an increase of $53 million as compared to the same period in 1998. The increase in G&A expenses was
principally attributable to increased personnel expenses to support the growth of the DISH Network. G&A expenses
as a percentage of total revenue increased to 9% during the year ended December 31, 1999 compared to 10% during
the same period in 1998.
Non-cash, Stock-based Compensation. During 1999, we adopted an incentive plan which provided certain
key employees with incentives including stock options. The payment of these incentives was contingent upon our
achievement of certain financial and other goals. We met certain of these goals during 1999. Accordingly, during
1999, we recorded approximately $179 million of deferred compensation related to post-grant appreciation of stock
options granted pursuant to the 1999 incentive plan. The related deferred compensation will be recognized over the
five-year period. Accordingly, during the year ended December 31, 1999 we recognized $61 million under this
performance-based plan.
Pre-Marketing Cash Flow. Pre-marketing cash flow is comprised of EBITDA plus total marketing expenses.
Pre-marketing cash flow was $554 million during the year ended December 31, 1999, an increase of 85% compared to
the same period in 1998. Our pre-marketing cash flow as a percentage of total revenue was 35% in 1999 compared to
31% in 1998. We believe that pre-marketing cash flow can be a useful measure of operating efficiency for companies
in the DBS industry.


