Dish Network 2000 Annual Report Download - page 36
Download and view the complete annual report
Please find page 36 of the 2000 Dish Network annual report below. You can navigate through the pages in the report by either clicking on the pages listed below, or by using the keyword search tool below to find specific information within the annual report.-
 1
1 -
2
-
3
-
4
-
5
-
6
-
7
-
8
-
9
-
10
-
11
-
12
-
13
-
14
-
15
-
16
-
17
-
18
-
19
-
20
-
21
-
22
-
23
-
24
-
25
-
 26
26 -
 27
27 -
 28
28 -
 29
29 -
 30
30 -
 31
31 -
 32
32 -
 33
33 -
 34
34 -
 35
35 -
 36
36 -
 37
37 -
 38
38 -
 39
39 -
 40
40 -
 41
41 -
 42
42 -
 43
43 -
 44
44 -
 45
45 -
 46
46 -
47
-
48
-
49
-
50
-
51
-
52
-
53
-
54
-
55
-
56
-
57
-
58
-
59
-
60
-
61
-
62
-
63
-
64
-
65
-
66
-
67
-
68
-
69
-
70
-
71
-
72
-
73
-
74
-
75
-
76
-
77
-
78
-
79
-
80
-
81
-
82
-
83
-
84
-
85
-
86
 |
 |

34
Our subscriber acquisition costs, both in the aggregate and on a per new subscriber activation basis, may
materially increase further to the extent that we continue or expand our Free Now program, or introduce other more
aggressive promotions if we determine that they are necessary to respond to competition, or for other reasons.
General and Administrative Expenses. General and administrative expenses totaled $250 million during the
year ended December 31, 2000, an increase of $100 million as compared to the same period in 1999. The increase in
G&A expenses was principally attributable to increased personnel expenses to support the growth of the DISH
Network. G&A expenses represented 9% of total revenue during the years ended December 31, 2000 and 1999.
Although we expect G&A expenses as a percentage of total revenue to remain near the current level or decline
modestly in future periods, this expense to revenue ratio could increase.
Non-cash, Stock-based Compensation. During 1999, we adopted an incentive plan which provided certain
key employees with incentives including stock options. The payment of these incentives was contingent upon our
achievement of certain financial and other goals. We met certain of these goals during 1999. Accordingly, during
1999, we recorded approximately $179 million of deferred compensation related to post-grant appreciation of stock
options granted pursuant to the 1999 incentive plan. The related deferred compensation will be recognized over the
five-year vesting period. Accordingly, during the years ended December 31, 2000 and 1999 we recognized
$51 million and $61 million, respectively, under this performance-based plan.
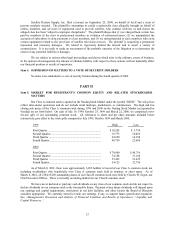
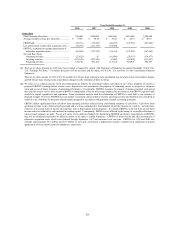
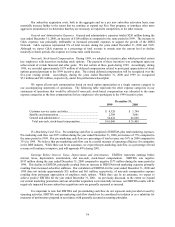
We report all non-cash compensation based on stock option appreciation as a single expense category in
our accompanying statements of operations. The following table represents the other expense categories in our
statements of operations that would be affected if non-cash, stock-based compensation was allocated to the same
expense categories as the base compensation for key employees who participate in the 1999 incentive plan:
December 31,
1999 2000
Customer service center and other........................................ $ 4,328 $ 1,744
Satellite and transmission .................................................... 2,308 3,061
General and administrative .................................................. 54,424 46,660
Total non-cash, stock-based compensation........................ $ 61,060 $ 51,465
Pre-Marketing Cash Flow. Pre-marketing cash flow is comprised of EBITDA plus total marketing expenses.
Pre-marketing cash flow was $971 million during the year ended December 31, 2000, an increase of 75% compared to
the same period in 1999. Our pre-marketing cash flow as a percentage of total revenue was 36% in 2000 compared to
35% in 1999. We believe that pre-marketing cash flow can be a useful measure of operating efficiency for companies
in the DBS industry. While there can be no assurance, we expect that pre-marketing cash flow as a percentage of total
revenue will continue to improve, and will approach 40% during 2001.
Earnings Before Interest, Taxes, Depreciation and Amortization. EBITDA represents earnings before
interest, taxes, depreciation, amortization, and non-cash, stock-based compensation. EBITDA was negative
$187 million during the year ended December 31, 2000 compared to negative $173 million during the same period in
1999. This decline in EBITDA principally resulted from an increase in DISH Network marketing expenses primarily
resulting from increased subscriber additions. Our calculation of EBITDA for the years ended December 31, 2000 and
1999 does not include approximately $51 million and $61 million, respectively, of non-cash compensation expense
resulting from post-grant appreciation of employee stock options. While there can be no assurance, we expect to
achieve positive EBITDA for the year ended December 31, 2001. As previously discussed, to the extent we expand
our current marketing promotions and our subscriber acquisition costs materially increase, our EBITDA results will be
negatively impacted because subscriber acquisition costs are generally expensed as incurred.
It is important to note that EBITDA and pre-marketing cash flow do not represent cash provided or used by
operating activities. EBITDA and pre-marketing cash flow should not be considered in isolation or as a substitute for
measures of performance prepared in accordance with generally accepted accounting principles.