Dish Network 2000 Annual Report Download - page 37
Download and view the complete annual report
Please find page 37 of the 2000 Dish Network annual report below. You can navigate through the pages in the report by either clicking on the pages listed below, or by using the keyword search tool below to find specific information within the annual report.35
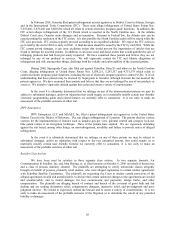
Depreciation and Amortization. Depreciation and amortization expenses aggregated $185 million during the
year ended December 31, 2000, a $72 million increase compared to the same period in 1999. The increase in
depreciation and amortization expenses principally resulted from an increase in depreciation related to the
commencement of operation of EchoStar V in November 1999 and EchoStar VI in October 2000 and other depreciable
assets placed in service during 2000 and late 1999.
Other Income and Expense. Other expense, net, totaled $197 million during the year ended
December 31, 2000, an increase of $20 million compared to the same period in 1999. This increase resulted from an
increase in interest expense as a result of the issuance of our 10 3/8% Senior Notes due 2007 in September 2000. This
increase in interest expense was partially offset by an increase in interest income.
Year Ended December 31, 1999 compared to the year ended December 31, 1998.
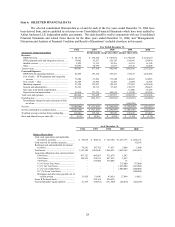
Revenue. Total revenue for the year ended December 31, 1999 was $1.603 billion, an increase of $620
million compared to total revenue for the year ended December 31, 1998 of $983 million. The increase in total
revenue was primarily attributable to DISH Network subscriber growth.
DISH Network subscription television services revenue totaled $1.344 billion for the year ended December
31, 1999, an increase of $675 million compared to the same period in 1998. This increase was directly attributable to
the increase in the number of DISH Network subscribers and higher average revenue per subscriber. Average DISH
Network subscribers for the year ended December 31, 1999 increased approximately 85% compared to the same
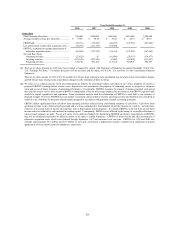
period in 1998. As of December 31, 1999, we had approximately 3.4 million DISH Network subscribers compared
to 1.9 million at December 31, 1998. Monthly revenue per subscriber was approximately $42.71 during the year
ended December 31, 1999 and approximated $39.25 during the same period during 1998. DISH Network
subscription television services revenue principally consists of revenue from basic, premium and pay-per-view
subscription television services.
For the year ended December 31, 1999, DTH equipment sales and integration services totaled $184 million,
a decrease of $72 million compared to the same period during 1998. DTH equipment sales consist of sales of digital
set-top boxes and other digital satellite broadcasting equipment to international DTH service operators and sales of
DBS accessories. This expected decrease in DTH equipment sales and integration services revenue was primarily
attributable to a decrease in demand combined with a decrease in the sales price of digital set-top boxes attributable
to increased competition.
Satellite services revenue totaled $41 million during 1999, an increase of $19 million as compared to the
same period during 1998. These revenues principally include fees charged to content providers for signal carriage
and revenues earned from business television, or BTV customers. The increase in satellite services revenue was
primarily attributable to increased BTV revenue due to the addition of new full-time BTV customers.
DISH Network Operating Expenses. DISH Network operating expenses totaled $733 million during 1999,
an increase of $338 million or 85%, compared to the same period in 1998. The increase in DISH Network operating
expenses was consistent with, and primarily attributable to, the increase in the number of DISH Network
subscribers. DISH Network operating expenses represented 55% and 59% of subscription television services
revenue during the years ended December 31, 1999 and 1998, respectively.
Subscriber-related expenses totaled $575 million during 1999, an increase of $278 million compared to the
same period in 1998. Such expenses, which include programming expenses, copyright royalties, residuals payable to
retailers and distributors, and billing, lockbox and other variable subscriber expenses, represented 43% of
subscription television services revenues during the year ended December 31, 1999 compared to 44% during the
same period in 1998.
Customer service center and other expenses principally consist of costs incurred in the operation of our
DISH Network customer service centers, such as personnel and telephone expenses, as well as subscriber equipment
installation and other operating expenses. Customer service center and other expenses totaled $117 million during
1999, an increase of $45 million as compared to the same period in 1998. The increase in customer service center
and other expenses resulted from increased personnel and telephone expenses to support the growth of the DISH


