Dell 2010 Annual Report Download - page 82
Download and view the complete annual report
Please find page 82 of the 2010 Dell annual report below. You can navigate through the pages in the report by either clicking on the pages listed below, or by using the keyword search tool below to find specific information within the annual report.-
 1
1 -
2
-
3
-
4
-
5
-
6
-
7
-
8
-
9
-
10
-
11
-
12
-
13
-
14
-
15
-
16
-
17
-
18
-
19
-
20
-
21
-
22
-
23
-
24
-
25
-
26
-
27
-
28
-
29
-
30
-
31
-
32
-
33
-
34
-
35
-
36
-
37
-
38
-
39
-
40
-
41
-
42
-
43
-
44
-
45
-
46
-
47
-
48
-
49
-
50
-
51
-
52
-
53
-
54
-
55
-
56
-
57
-
58
-
59
-
60
-
61
-
62
-
63
-
64
-
65
-
66
-
67
-
68
-
69
-
70
-
71
-
 72
72 -
 73
73 -
 74
74 -
 75
75 -
 76
76 -
 77
77 -
 78
78 -
 79
79 -
 80
80 -
 81
81 -
 82
82 -
 83
83 -
 84
84 -
 85
85 -
 86
86 -
 87
87 -
 88
88 -
 89
89 -
 90
90 -
 91
91 -
 92
92 -
93
-
94
-
95
-
96
-
97
-
98
-
99
-
100
-
101
-
102
-
103
-
104
-
105
-
106
-
107
-
108
-
109
-
110
-
111
-
112
-
113
-
114
-
115
-
116
-
117
-
118
-
119
-
120
-
121
-
122
-
123
-
124
-
125
-
126
-
127
-
128
-
129
-
130
-
131
-
132
-
133
-
134
-
135
-
136
-
137
-
138
-
139
-
140
-
141
-
142
-
143
-
144
-
145
-
146
-
147
-
148
-
149
-
150
-
151
-
152
-
153
-
154
 |
 |
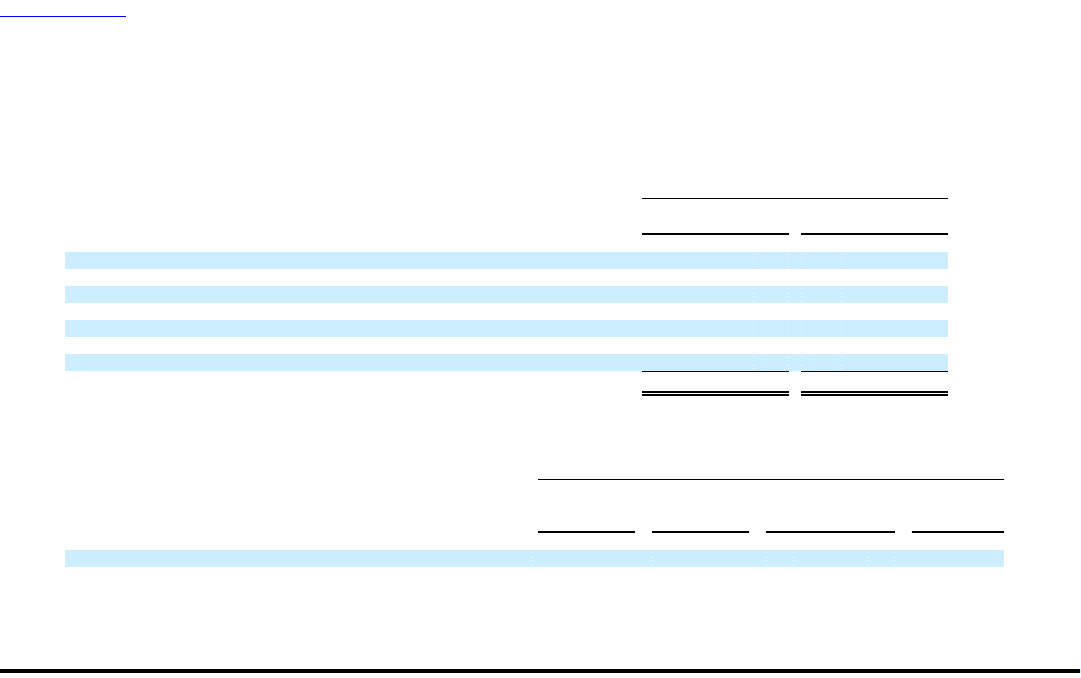
Table of Contents
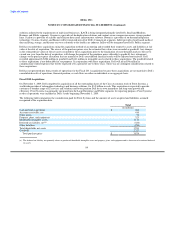
DELL INC.
NOTES TO CONSOLIDATED FINANCIAL STATEMENTS (Continued)
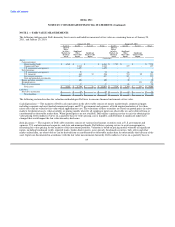
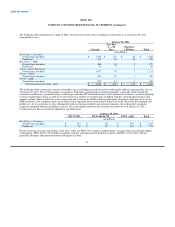
The following table summarizes the activity in retained interest balances:
Fiscal Year Ended
January 29, January 30,
2010 2009
(in millions)
Retained interest:
Retained interest at beginning of period $ 396 $ 223
Issuances 322 427
Distributions from conduits (91) (246)
Net accretion 31 16
Change in fair value for the period (5) (24)
Impact of special purpose entity consolidation (502) -
Retained interest at end of the period $ 151 $ 396
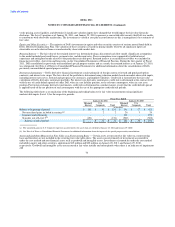
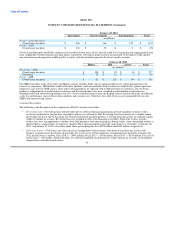
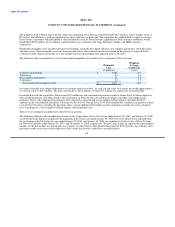
The following table summarizes the key assumptions used to measure the fair value of the retained interest of the fixed term leases and
loans at time of transfer within the fiscal year ended January 29, 2010 :
Weighted Average Key Assumptions
Monthly
Payment Credit Discount
Rates Losses Rates Life
(lifetime) (annualized) (months)
Time of transfer valuation of retained interest 5% 1% 12% 20
Net principal charge-offs for securitized leases and loans held by formerly nonconsolidated special purpose entities were $70.4 million
for Fiscal 2010, which was 6.5% of the average outstanding securitized financing receivable balance for the period.
78