Dell 2010 Annual Report Download - page 77
Download and view the complete annual report
Please find page 77 of the 2010 Dell annual report below. You can navigate through the pages in the report by either clicking on the pages listed below, or by using the keyword search tool below to find specific information within the annual report.-
 1
1 -
2
-
3
-
4
-
5
-
6
-
7
-
8
-
9
-
10
-
11
-
12
-
13
-
14
-
15
-
16
-
17
-
18
-
19
-
20
-
21
-
22
-
23
-
24
-
25
-
26
-
27
-
28
-
29
-
30
-
31
-
32
-
33
-
34
-
35
-
36
-
37
-
38
-
39
-
40
-
41
-
42
-
43
-
44
-
45
-
46
-
47
-
48
-
49
-
50
-
51
-
52
-
53
-
54
-
55
-
56
-
57
-
58
-
59
-
60
-
61
-
62
-
63
-
64
-
65
-
66
-
 67
67 -
 68
68 -
 69
69 -
 70
70 -
 71
71 -
 72
72 -
 73
73 -
 74
74 -
 75
75 -
 76
76 -
 77
77 -
 78
78 -
 79
79 -
 80
80 -
 81
81 -
 82
82 -
 83
83 -
 84
84 -
 85
85 -
 86
86 -
 87
87 -
88
-
89
-
90
-
91
-
92
-
93
-
94
-
95
-
96
-
97
-
98
-
99
-
100
-
101
-
102
-
103
-
104
-
105
-
106
-
107
-
108
-
109
-
110
-
111
-
112
-
113
-
114
-
115
-
116
-
117
-
118
-
119
-
120
-
121
-
122
-
123
-
124
-
125
-
126
-
127
-
128
-
129
-
130
-
131
-
132
-
133
-
134
-
135
-
136
-
137
-
138
-
139
-
140
-
141
-
142
-
143
-
144
-
145
-
146
-
147
-
148
-
149
-
150
-
151
-
152
-
153
-
154
 |
 |

Table of Contents
DELL INC.
NOTES TO CONSOLIDATED FINANCIAL STATEMENTS (Continued)
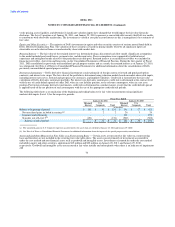
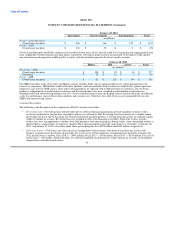
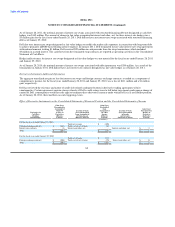
Prior to the first quarter of Fiscal 2011, customer receivables were either included in the Consolidated Financial Statements or held by
nonconsolidated securitization SPEs. In prior periods, Dell had a retained interest in the customer receivables held in nonconsolidated
securitization SPEs. The pro forma table below shows what customer receivables would have been if the nonconsolidated securitization
SPEs were consolidated as of January 29, 2010:
January 28, January 29,
2011 2010
(Pro forma)
(in millions)
Customer receivables, gross:
Consolidated receivables $ 4,388 $ 2,870
Receivables in previously nonconsolidated SPEs - 774
Customer receivables, gross $ 4,388 $ 3,644
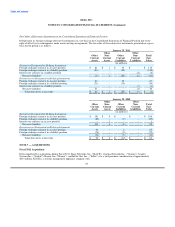
Included in financing receivables, net, are receivables that are held by consolidated VIEs as shown in the table below:
January 28, January 29,
2011 2010
(in millions)
Financing receivables held by consolidated VIEs, net:
Short-term, net $ 1,087 $ 277
Long-term, net 262 -
Financing receivables held by consolidated VIEs, net $ 1,349 $ 277
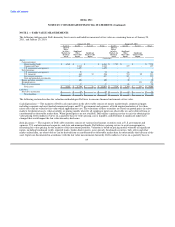
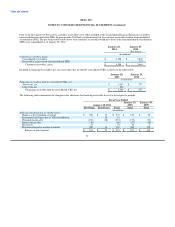
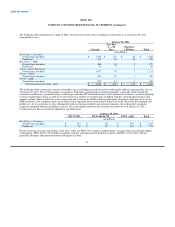
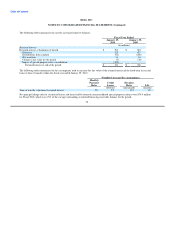
The following table summarizes the changes in the allowance for financing receivable losses for the respective periods:
Fiscal Year Ended
January 29, January 30,
January 28, 2011 2010 2009
Revolving Fixed-term Total Total Total
(in millions)
Allowance for financing receivable losses:
Balance at the beginning of period $ 224 $ 13 $ 237 $ 149 $ 96
Incremental allowance due to VIE consolidation - 16 16 - -
Principal charge-offs (233) (18) (251) (139) (91)
Interest charge-offs (46) - (46) (27) (19)
Recoveries 27 - 27 10 4
Provision charged to income statement 242 16 258 244 159
Balance at end of period $ 214 $ 27 $ 241 $ 237 $ 149
73