Dell 2010 Annual Report Download - page 78
Download and view the complete annual report
Please find page 78 of the 2010 Dell annual report below. You can navigate through the pages in the report by either clicking on the pages listed below, or by using the keyword search tool below to find specific information within the annual report.-
 1
1 -
2
-
3
-
4
-
5
-
6
-
7
-
8
-
9
-
10
-
11
-
12
-
13
-
14
-
15
-
16
-
17
-
18
-
19
-
20
-
21
-
22
-
23
-
24
-
25
-
26
-
27
-
28
-
29
-
30
-
31
-
32
-
33
-
34
-
35
-
36
-
37
-
38
-
39
-
40
-
41
-
42
-
43
-
44
-
45
-
46
-
47
-
48
-
49
-
50
-
51
-
52
-
53
-
54
-
55
-
56
-
57
-
58
-
59
-
60
-
61
-
62
-
63
-
64
-
65
-
66
-
67
-
 68
68 -
 69
69 -
 70
70 -
 71
71 -
 72
72 -
 73
73 -
 74
74 -
 75
75 -
 76
76 -
 77
77 -
 78
78 -
 79
79 -
 80
80 -
 81
81 -
 82
82 -
 83
83 -
 84
84 -
 85
85 -
 86
86 -
 87
87 -
 88
88 -
89
-
90
-
91
-
92
-
93
-
94
-
95
-
96
-
97
-
98
-
99
-
100
-
101
-
102
-
103
-
104
-
105
-
106
-
107
-
108
-
109
-
110
-
111
-
112
-
113
-
114
-
115
-
116
-
117
-
118
-
119
-
120
-
121
-
122
-
123
-
124
-
125
-
126
-
127
-
128
-
129
-
130
-
131
-
132
-
133
-
134
-
135
-
136
-
137
-
138
-
139
-
140
-
141
-
142
-
143
-
144
-
145
-
146
-
147
-
148
-
149
-
150
-
151
-
152
-
153
-
154
 |
 |
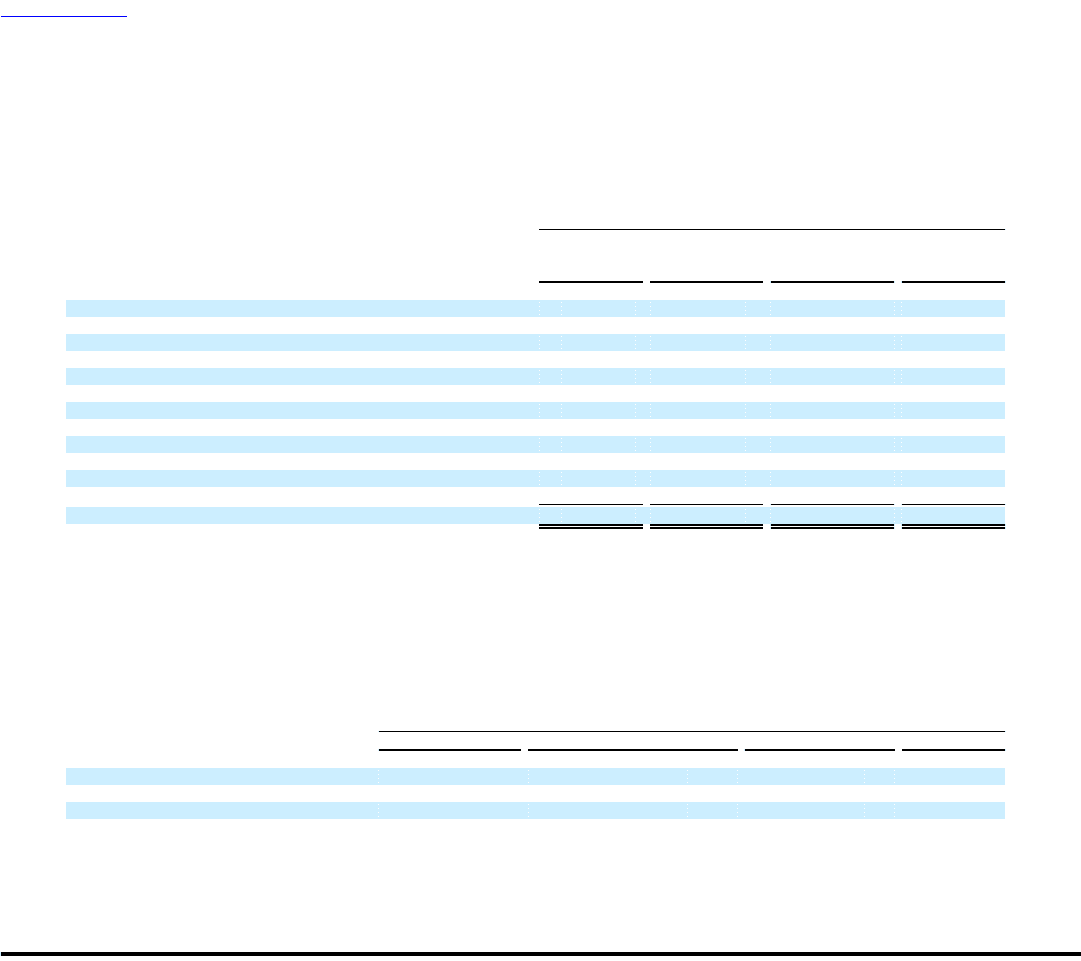
Table of Contents
DELL INC.
NOTES TO CONSOLIDATED FINANCIAL STATEMENTS (Continued)
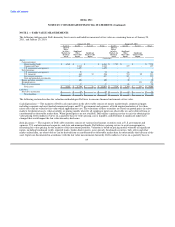
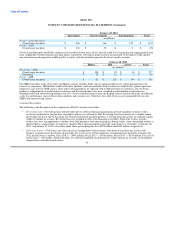
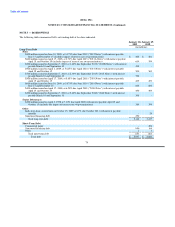
The following table summarizes the aging of Dell's customer receivables, gross, including accrued interest, as of January 28, 2011
segregated by class:
January 28, 2011
Past Due
1 — 90 Past Due
Current Days > 90 Days Total
(in millions)
Revolving — Consumer
Owned since inception $ 1,302 $ 153 $ 48 $ 1,503
Purchased 447 88 35 570
Revolving — SMB
Owned since inception 246 26 5 277
Purchased 34 9 3 46
Fixed — Large Enterprise
Owned since inception 1,077 47 7 1,131
Fixed — Public
Owned since inception 463 12 1 476
Fixed — SMB
Owned since inception 371 11 3 385
Total customer receivables, gross $ 3,940 $ 346 $ 102 $ 4,388
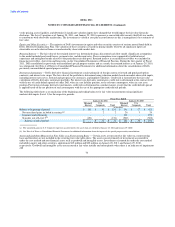
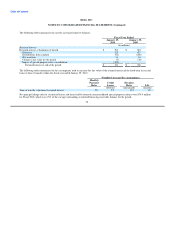
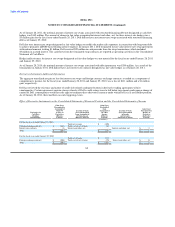
The following tables summarize customer receivables, gross, including accrued interest by credit quality indicator segregated by class as
of January 28, 2011. For revolving loans to consumers, Dell makes credit decisions based on propriety scorecards which include the
customer's credit history, payment history, credit usage, and other FICO-related elements. For Commercial customers, an internal grading
system is utilized that assigns a credit level score based on a number of considerations including liquidity, operating performance and
industry outlook. These credit level scores range from one to sixteen for Public and Large Enterprise customers, and from one to six for
SMB customers. The categories shown in the tables below segregate between the relative degrees of credit risk within that segment and
product set. As loss experience varies substantially between financial products and customer segments, the credit quality categories
cannot be compared between the different classes. The credit quality indicators for Consumer accounts are as of January 28, 2011.
Commercial accounts are generally updated on a periodic basis.
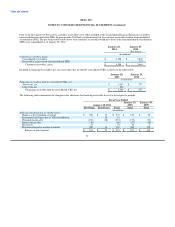
January 28, 2011
FICO 720+ FICO 660 to 719 FICO < 660 Total
(in millions)
Revolving — Consumer
Owned since inception $ 251 $ 415 $ 837 $ 1,503
Purchased $ 50 $ 127 $ 393 $ 570
For the revolving consumer receivables in the above table, the FICO 720+ category includes prime accounts which are generally higher
credit quality, FICO 660 to 719 includes near-prime accounts and represents the mid-tier accounts, and FICO scores below 660 are
generally sub-prime and represent lower credit quality accounts.
74