Dell 2010 Annual Report Download - page 29
Download and view the complete annual report
Please find page 29 of the 2010 Dell annual report below. You can navigate through the pages in the report by either clicking on the pages listed below, or by using the keyword search tool below to find specific information within the annual report.-
 1
1 -
2
-
3
-
4
-
5
-
6
-
7
-
8
-
9
-
10
-
11
-
12
-
13
-
14
-
15
-
16
-
17
-
18
-
 19
19 -
 20
20 -
 21
21 -
 22
22 -
 23
23 -
 24
24 -
 25
25 -
 26
26 -
 27
27 -
 28
28 -
 29
29 -
 30
30 -
 31
31 -
 32
32 -
 33
33 -
 34
34 -
 35
35 -
 36
36 -
 37
37 -
 38
38 -
 39
39 -
40
-
41
-
42
-
43
-
44
-
45
-
46
-
47
-
48
-
49
-
50
-
51
-
52
-
53
-
54
-
55
-
56
-
57
-
58
-
59
-
60
-
61
-
62
-
63
-
64
-
65
-
66
-
67
-
68
-
69
-
70
-
71
-
72
-
73
-
74
-
75
-
76
-
77
-
78
-
79
-
80
-
81
-
82
-
83
-
84
-
85
-
86
-
87
-
88
-
89
-
90
-
91
-
92
-
93
-
94
-
95
-
96
-
97
-
98
-
99
-
100
-
101
-
102
-
103
-
104
-
105
-
106
-
107
-
108
-
109
-
110
-
111
-
112
-
113
-
114
-
115
-
116
-
117
-
118
-
119
-
120
-
121
-
122
-
123
-
124
-
125
-
126
-
127
-
128
-
129
-
130
-
131
-
132
-
133
-
134
-
135
-
136
-
137
-
138
-
139
-
140
-
141
-
142
-
143
-
144
-
145
-
146
-
147
-
148
-
149
-
150
-
151
-
152
-
153
-
154
 |
 |

Table of Contents
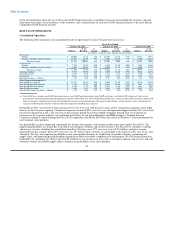
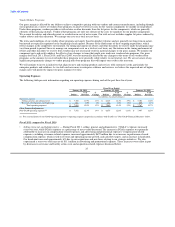
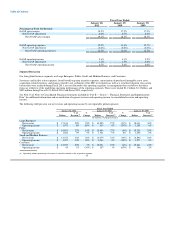
Revenue
Fiscal 2011 compared to Fiscal 2010
• Product Revenue — Product revenue increased year-over-year by 14% for Fiscal 2011. Our product revenue performance was
primarily attributable to improved customer demand as a result of increased global IT spending from our Commercial customers
across all product categories as well as a shift in mix to higher priced products. See "Revenue by Product and Services Categories"
for further information regarding the average selling prices of our products.
• Services Revenue, including software related — Services revenue, including software related increased year-over-year by 25% for
Fiscal 2011. Our services revenue performance was attributable to a 36% year-over-year increase in services revenue and an increase
of 7% in software related services revenue during Fiscal 2011. The increase in services revenue was primarily due to our acquisition
of Perot Systems in the fourth quarter of Fiscal 2010, which was integrated into our Public and Large Enterprise segments.
During Fiscal 2011, revenue from the U.S. increased 14% to $31.9 billion and represented 52% of total net revenue. Revenue from
outside the U.S. increased 19% to $29.6 billion and represented 48% of total net revenue. Revenue from Brazil, Russia, India, and China,
which we refer to as "BRIC," increased 38% year-over-year, on a combined basis, for Fiscal 2011. Total revenue from BRIC has been
increasing sequentially since the fourth quarter of Fiscal 2009 and represented 12.3% of our total net revenue for Fiscal 2011 compared to
10.5% in the prior year. We are continuing to expand into these and other emerging countries that represent the vast majority of the
world's population, tailor solutions to meet specific regional needs, and enhance relationships to provide customer choice and flexibility.
We manage our business on a U.S. dollar basis and utilize a comprehensive hedging strategy intended to mitigate the impact of foreign
currency volatility over time. As a result of our hedging programs, the impact of currency movements was not material to our total net
revenue for Fiscal 2011, Fiscal 2010, or Fiscal 2009.
Fiscal 2010 compared to Fiscal 2009
• Product Revenue — Product revenue and unit shipments decreased year-over-year by 17% and 6%, respectively, for Fiscal 2010. Our
product revenue performance was primarily attributable to a decrease in customer demand from our Commercial segments and lower
average selling prices in our Consumer segment.
• Services Revenue, including software related — Services revenue, including software related increased year-over-year by 5% during
Fiscal 2010. The increase in services revenue was largely due to our acquisition of Perot Systems, which contributed $588 million in
services revenue during the fourth quarter of Fiscal 2010. Excluding the contribution by Perot Systems, services revenue decreased
2%. Our service offerings have traditionally been tied to the sale of hardware; therefore, the 6% decline in hardware demand
negatively impacted our services revenue.
Outside the U.S., we experienced a 16% year-over-year revenue decline for Fiscal 2010 compared to an approximate decline of 11% in
revenue for the U.S. during the same period. Revenue outside the U.S. represented approximately 47% of net revenue for Fiscal 2010. At
a consolidated level, BRIC revenue increased 4% during Fiscal 2010.
Gross Margin
Fiscal 2011 compared to Fiscal 2010
• Products — During Fiscal 2011, product gross margins increased in absolute dollars year-over-year and in gross margin percentage.
Product gross margin percentage increased from 14.1% for Fiscal 2010 to 15.9% for Fiscal 2011. Decreasing component costs,
improved pricing discipline, better sales and supply chain execution, and improved quality resulting in favorable warranty experience
contributed to the year-over-year increase in product gross margin percentage. We have created a flexible supply chain that has
improved our supply chain execution and have simplified our product offerings. Additionally, in the second half of Fiscal 2011, we
began to
25