Dell 2010 Annual Report Download - page 39
Download and view the complete annual report
Please find page 39 of the 2010 Dell annual report below. You can navigate through the pages in the report by either clicking on the pages listed below, or by using the keyword search tool below to find specific information within the annual report.-
 1
1 -
2
-
3
-
4
-
5
-
6
-
7
-
8
-
9
-
10
-
11
-
12
-
13
-
14
-
15
-
16
-
17
-
18
-
19
-
20
-
21
-
22
-
23
-
24
-
25
-
26
-
27
-
28
-
 29
29 -
 30
30 -
 31
31 -
 32
32 -
 33
33 -
 34
34 -
 35
35 -
 36
36 -
 37
37 -
 38
38 -
 39
39 -
 40
40 -
 41
41 -
 42
42 -
 43
43 -
 44
44 -
 45
45 -
 46
46 -
 47
47 -
 48
48 -
 49
49 -
50
-
51
-
52
-
53
-
54
-
55
-
56
-
57
-
58
-
59
-
60
-
61
-
62
-
63
-
64
-
65
-
66
-
67
-
68
-
69
-
70
-
71
-
72
-
73
-
74
-
75
-
76
-
77
-
78
-
79
-
80
-
81
-
82
-
83
-
84
-
85
-
86
-
87
-
88
-
89
-
90
-
91
-
92
-
93
-
94
-
95
-
96
-
97
-
98
-
99
-
100
-
101
-
102
-
103
-
104
-
105
-
106
-
107
-
108
-
109
-
110
-
111
-
112
-
113
-
114
-
115
-
116
-
117
-
118
-
119
-
120
-
121
-
122
-
123
-
124
-
125
-
126
-
127
-
128
-
129
-
130
-
131
-
132
-
133
-
134
-
135
-
136
-
137
-
138
-
139
-
140
-
141
-
142
-
143
-
144
-
145
-
146
-
147
-
148
-
149
-
150
-
151
-
152
-
153
-
154
 |
 |

Table of Contents
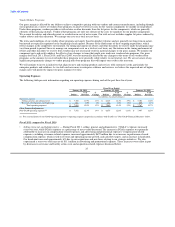
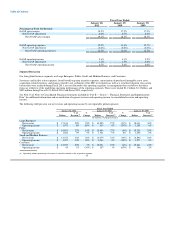
For Fiscal 2011, Consumer's operating income percentage decreased 40 basis points year-over-year to 0.5%. The decrease in
operating income percentage was largely attributable to a decrease in gross margin percentage. Consumer gross margin decreased due
to the shift in sales mix from direct to indirect sales, which generally carry lower gross margin, which was not entirely offset by
decreases in operating expenses as a percentage of revenue. Operating expenses as a percentage of revenue remained relatively flat
year-over-year. In the second half of Fiscal 2011, Dell Financial Services, which provides financing to our customers, experienced
improved delinquency and charge-off rates that partially offset the decrease in Consumer's operating income percentage. During the
first quarter of Fiscal 2011, we combined Consumer and SMB under a single leadership team to reduce overall costs, though we are
continuing to manage and report the two segments separately. From time to time, we monetize aspects of the Consumer business
model with arrangements with vendors and suppliers, such as revenue sharing arrangements, which we believe will continue to
contribute to and improve Consumer's operating income over time. The impact of our vendor and supplier arrangements was not
material to our Fiscal 2011 results as compared to Fiscal 2010.
We expect to see the broad corporate refresh to continue for our Large Enterprise and SMB customers, with a favorable component
cost environment that will continue through the first half of Fiscal 2012. We believe that, with the appropriate pricing strategy, we
will continue to have opportunities to deliver strong year-over-year growth for our Large Enterprise and SMB segments. We expect
that the Public segment will see growth, but that certain regions will continue to be impacted by budgetary constraints given the
current economic environment. For our Consumer segment, we will continue to develop new products to move back to a mix of
higher price band offerings, improve our supply chain, and focus on delivering a superior customer service experience to position our
Consumer business for sustained profitable growth.
Fiscal 2010 compared to Fiscal 2009
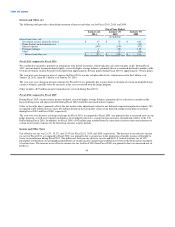
• Large Enterprise — The decrease in Large Enterprise revenue during Fiscal 2010 was mainly due to the global economic downturn
that began in the second half of Fiscal 2009. During Fiscal 2010, revenue from desktop PCs, mobility products, and storage items all
declined approximately 30% year-over-year, and software and peripherals and servers and networking declined 19% and 4%,
respectively. Services revenue increased year-over-year by 2%, which was largely due to the 48% increase in fourth quarter revenue,
36% of which was contributed by the acquisition of Perot Systems. Large Enterprise revenue decreased significantly year-over-year
across most countries.
During Fiscal 2010, operating income percentage decreased 70 basis points year-over-year to 5.7%. Operating income deteriorated as
revenue decreased year-over-year due to lower demand. Additionally, operating expenses as a percentage of revenue increased
year-over-year even though operating expense dollars decreased 17%.
• Public — Public experienced a year-over-year decline in revenue during Fiscal 2010 due to the soft demand in the global economy.
During Fiscal 2010, Public's revenue declined across all product categories except for services, and software and peripherals revenue,
which grew year-over-year by 28% and 5%, respectively. The growth in services revenue was largely due to the acquisition of Perot
Systems, which contributed $418 million to Public's Fiscal 2010 services revenue. Without the contribution by Perot Systems,
Public's services revenue would have remained relatively flat with the prior year. The product revenue decline was led by lower
revenue from sales of desktop PCs, which decreased year-over-year by 20%.
During Fiscal 2010, operating income percentage increased 120 basis points year-over-year to 9.4%. Operating income was
positively impacted by a year-over-year improvement in gross margin percentage during Fiscal 2010 as we continued to optimize our
pricing and cost structure and sell higher value solutions to our customers. The addition of Perot Systems contributed 3% to the
growth in operating income. Also favorably impacting operating income was a 5% year-over-year decrease in operating expenses
during Fiscal 2010, driven by cost savings related to headcount reductions and improved spending controls on SG&A and RD&E
expenditures.
• Small and Medium Business — During Fiscal 2010, SMB experienced a 19% year-over-year decline in revenue due to double digit
revenue declines across all product lines except storage and services. The revenue declines were led by a 28% and 18% decline in
desktop PC and mobility revenue, respectively. We limited our
35