Dell 2010 Annual Report Download - page 31
Download and view the complete annual report
Please find page 31 of the 2010 Dell annual report below. You can navigate through the pages in the report by either clicking on the pages listed below, or by using the keyword search tool below to find specific information within the annual report.-
 1
1 -
2
-
3
-
4
-
5
-
6
-
7
-
8
-
9
-
10
-
11
-
12
-
13
-
14
-
15
-
16
-
17
-
18
-
19
-
20
-
 21
21 -
 22
22 -
 23
23 -
 24
24 -
 25
25 -
 26
26 -
 27
27 -
 28
28 -
 29
29 -
 30
30 -
 31
31 -
 32
32 -
 33
33 -
 34
34 -
 35
35 -
 36
36 -
 37
37 -
 38
38 -
 39
39 -
 40
40 -
 41
41 -
42
-
43
-
44
-
45
-
46
-
47
-
48
-
49
-
50
-
51
-
52
-
53
-
54
-
55
-
56
-
57
-
58
-
59
-
60
-
61
-
62
-
63
-
64
-
65
-
66
-
67
-
68
-
69
-
70
-
71
-
72
-
73
-
74
-
75
-
76
-
77
-
78
-
79
-
80
-
81
-
82
-
83
-
84
-
85
-
86
-
87
-
88
-
89
-
90
-
91
-
92
-
93
-
94
-
95
-
96
-
97
-
98
-
99
-
100
-
101
-
102
-
103
-
104
-
105
-
106
-
107
-
108
-
109
-
110
-
111
-
112
-
113
-
114
-
115
-
116
-
117
-
118
-
119
-
120
-
121
-
122
-
123
-
124
-
125
-
126
-
127
-
128
-
129
-
130
-
131
-
132
-
133
-
134
-
135
-
136
-
137
-
138
-
139
-
140
-
141
-
142
-
143
-
144
-
145
-
146
-
147
-
148
-
149
-
150
-
151
-
152
-
153
-
154
 |
 |

Table of Contents
Vendor Rebate Programs
Our gross margin is affected by our ability to achieve competitive pricing with our vendors and contract manufacturers, including through
our negotiation of a variety of vendor rebate programs to achieve lower net costs for the various components we include in our products.
Under these programs, vendors provide us with rebates or other discounts from the list prices for the components, which are generally
elements of their pricing strategy. Vendor rebate programs are only one element of the costs we negotiate for our product components.
We account for rebates and other discounts as a reduction in cost of net revenue. Our total net cost includes supplier list prices reduced by
vendor rebates and other discounts. We manage our costs on a total net cost basis.
The terms and conditions of our vendor rebate programs are largely based on product volumes and are generally not long-term in nature,
but instead are typically negotiated at the beginning of each quarter. Because of the fluid nature of these ongoing negotiations, which
reflect changes in the competitive environment, the timing and amount of rebates and other discounts we receive under the programs may
vary from period to period. Since we manage our component costs on a total net cost basis, any fluctuations in the timing and amount of
rebates and other discounts we receive from vendors may not necessarily result in material changes to our gross margin. We monitor our
component costs and seek to address the effects of any changes to terms that might arise under our vendor rebate programs. Our gross
margins for Fiscal 2011, Fiscal 2010, and Fiscal 2009, were not materially affected by any changes to the terms of our vendor rebate
programs, as the amounts we received under these programs were generally stable relative to our total net cost. We are not aware of any
significant programmatic changes to vendor pricing and rebate programs that will impact our results in the near term.
We will continue to invest in initiatives that align our new and existing products and services with customers' needs, particularly for
enterprise products and solutions. As we shift our focus more to enterprise solutions and services, we believe the improved mix of higher
margin sales will positively impact our gross margins over time.
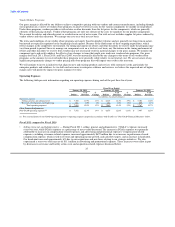
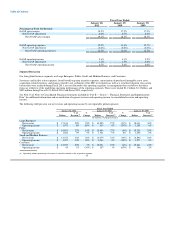
Operating Expenses
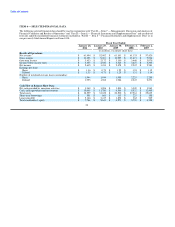
The following table presents information regarding our operating expenses during each of the past three fiscal years:
Fiscal Year Ended
January 28, 2011 January 29, 2010 January 30, 2009
% of % % of % % of
Dollars Revenue Change Dollars Revenue Change Dollars Revenue
(in millions, except percentages)
Operating expenses:
Selling, general, and administrative $ 7,302 11.9% 13% $ 6,465 12.2% (9%) $ 7,102 11.6%
Research, development, and engineering 661 1.0% 6% 624 1.2% (6%) 665 1.1%
Total operating expenses $ 7,963 12.9% 12% $ 7,089 13.4% (9%) $ 7,767 12.7%
Other Financial Information
Non-GAAP operating expenses(a) $ 7,582 12.3% 14% $ 6,675 12.6% (11%) $ 7,497 12.3%
(a) For a reconciliation of non-GAAP operating expenses to operating expenses prepared in accordance with GAAP, see "Non-GAAP Financial Measures" below.
Fiscal 2011 compared to Fiscal 2010
• Selling, General, and Administrative — During Fiscal 2011, selling, general, and administrative ("SG&A") expenses increased
year-over-year, while SG&A expenses as a percentage of net revenue decreased. The increase in SG&A expenses was primarily
attributable to increases in compensation-related expenses and advertising and promotional expenses. Compensation-related
expenses, excluding severance-related expenses, increased approximately $679 million due to an increase in performance-based
compensation expense, which is tied to revenue and operating income growth, and cash flow targets, and an increase in headcount.
Our headcount increased approximately 6% due to our acquisitions and new hires relating to our strategic initiatives. We also
experienced a year-over-year increase of $111 million in advertising and promotional expenses. These increases were offset in part
by decreases in severance and facility action costs and acquisition-related expenses discussed below.
27