Dell 2010 Annual Report Download - page 28
Download and view the complete annual report
Please find page 28 of the 2010 Dell annual report below. You can navigate through the pages in the report by either clicking on the pages listed below, or by using the keyword search tool below to find specific information within the annual report.-
 1
1 -
2
-
3
-
4
-
5
-
6
-
7
-
8
-
9
-
10
-
11
-
12
-
13
-
14
-
15
-
16
-
17
-
 18
18 -
 19
19 -
 20
20 -
 21
21 -
 22
22 -
 23
23 -
 24
24 -
 25
25 -
 26
26 -
 27
27 -
 28
28 -
 29
29 -
 30
30 -
 31
31 -
 32
32 -
 33
33 -
 34
34 -
 35
35 -
 36
36 -
 37
37 -
 38
38 -
39
-
40
-
41
-
42
-
43
-
44
-
45
-
46
-
47
-
48
-
49
-
50
-
51
-
52
-
53
-
54
-
55
-
56
-
57
-
58
-
59
-
60
-
61
-
62
-
63
-
64
-
65
-
66
-
67
-
68
-
69
-
70
-
71
-
72
-
73
-
74
-
75
-
76
-
77
-
78
-
79
-
80
-
81
-
82
-
83
-
84
-
85
-
86
-
87
-
88
-
89
-
90
-
91
-
92
-
93
-
94
-
95
-
96
-
97
-
98
-
99
-
100
-
101
-
102
-
103
-
104
-
105
-
106
-
107
-
108
-
109
-
110
-
111
-
112
-
113
-
114
-
115
-
116
-
117
-
118
-
119
-
120
-
121
-
122
-
123
-
124
-
125
-
126
-
127
-
128
-
129
-
130
-
131
-
132
-
133
-
134
-
135
-
136
-
137
-
138
-
139
-
140
-
141
-
142
-
143
-
144
-
145
-
146
-
147
-
148
-
149
-
150
-
151
-
152
-
153
-
154
 |
 |
Table of Contents
below for information about our use of these non-GAAP financial measures, including our reasons for including the measures, material
limitations with respect to the usefulness of the measures, and a reconciliation of each non-GAAP financial measure to the most directly
comparable GAAP financial measure.
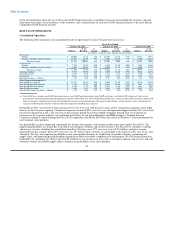
RESULTS OF OPERATIONS
Consolidated Operations
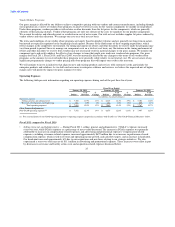
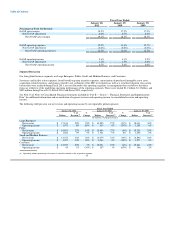
The following table summarizes our consolidated results of operations for each of the past three fiscal years:
Fiscal Year Ended
January 28, 2011 January 29, 2010 January 30, 2009
% of % % of % % of
Dollars Revenue Change Dollars Revenue Change Dollars Revenue
(in millions, except per share amounts and percentages)
Net revenue:
Product $ 50,002 81.3% 14% $ 43,697 82.6% (17%) $ 52,337 85.7%
Services, including software related 11,492 18.7% 25% 9,205 17.4% 5% 8,764 14.3%
Total net revenue $ 61,494 100.0% 16% $ 52,902 100% (13%) $ 61,101 100%
Gross margin:
Product $ 7,934 15.9% 29% $ 6,163 14.1% (20%) $ 7,667 14.6%
Services, including software related 3,462 30.1% 12% 3,098 33.7% (6%) 3,290 37.5%
Total gross margin $ 11,396 18.5% 23% $ 9,261 17.5% (15%) $ 10,957 17.9%
Operating expenses $ 7,963 12.9% 12% $ 7,089 13.4% (9%) $ 7,767 12.7%
Operating income $ 3,433 5.6% 58% $ 2,172 4.1% (32%) $ 3,190 5.2%
Net income $ 2,635 4.3% 84% $ 1,433 2.7% (42%) $ 2,478 4.1%
Earnings per share — diluted $ 1.35 N/A 85% $ 0.73 N/A (42%) $ 1.25 N/A
Other Financial Information(a)
Non-GAAP gross margin $ 11,731 19.1% 22% $ 9,649 18.2% (14%) $ 11,178 18.3%
Non-GAAP operating expenses $ 7,582 12.3% 14% $ 6,675 12.6% (11%) $ 7,497 12.3%
Non-GAAP operating income $ 4,149 6.7% 40% $ 2,974 5.6% (19%) $ 3,681 6.0%
Non-GAAP net income $ 3,106 5.1% 51% $ 2,054 3.9% (28%) $ 2,852 4.7%
Non-GAAP earnings per share — diluted $ 1.59 N/A 51% $ 1.05 N/A (27%) $ 1.44 N/A
(a) Non-GAAP gross margin, non-GAAP operating expenses, non-GAAP operating income, non-GAAP net income, and non-GAAP earnings per share are not
measurements of financial performance prepared in accordance with GAAP. See "Non-GAAP Financial Measures" below for information about these non-GAAP
financial measures, including our reasons for including the measures, material limitations with respect to the usefulness of the measures, and a reconciliation of
each non-GAAP financial measure to the most directly comparable GAAP financial measure.
During Fiscal 2011, our total net revenue increased 16% year-over-year with increases across all our Commercial segments, and a slight
increase in our Consumer segment. Commercial segments increased 20% year-over-year, and represented approximately 80% of our total
net revenue during Fiscal 2011. The recovery in the economy during Fiscal 2011 helped strengthen demand from our Commercial
customers as the corporate refresh cycle continued, particularly for our Large Enterprise and SMB customers. Demand from our
Consumer customers softened during late Fiscal 2011 compared to late Fiscal 2010 when the launch of Windows 7 increased demand for
our Consumer client products.
Our profitability has been improving sequentially for the past four quarters, with stronger results in the latter half of Fiscal 2011. The
improving profitability was in part due to growth in our enterprise solutions and services business. For Fiscal 2011, enterprise solutions
and services revenue, including the contribution from Perot Systems, grew 27% year-over-year to $17.6 billion, and gross margins
generated from this category grew 24% year-over-year. We believe these solutions are customized to the needs of users, easy to use, and
affordable. We have also improved profitability in our client product business by simplifying our product offerings, optimizing our
supply chain, and improving pricing discipline during this period of favorable component cost environment. We will remain focused on
profitability by continuing our efforts to provide IT solutions to our customers in areas such as enterprise solutions and services, and will
continue to utilize our flexible supply chain to enhance the profitability of our client products.
24