Dell 2010 Annual Report Download - page 112
Download and view the complete annual report
Please find page 112 of the 2010 Dell annual report below. You can navigate through the pages in the report by either clicking on the pages listed below, or by using the keyword search tool below to find specific information within the annual report.-
 1
1 -
2
-
3
-
4
-
5
-
6
-
7
-
8
-
9
-
10
-
11
-
12
-
13
-
14
-
15
-
16
-
17
-
18
-
19
-
20
-
21
-
22
-
23
-
24
-
25
-
26
-
27
-
28
-
29
-
30
-
31
-
32
-
33
-
34
-
35
-
36
-
37
-
38
-
39
-
40
-
41
-
42
-
43
-
44
-
45
-
46
-
47
-
48
-
49
-
50
-
51
-
52
-
53
-
54
-
55
-
56
-
57
-
58
-
59
-
60
-
61
-
62
-
63
-
64
-
65
-
66
-
67
-
68
-
69
-
70
-
71
-
72
-
73
-
74
-
75
-
76
-
77
-
78
-
79
-
80
-
81
-
82
-
83
-
84
-
85
-
86
-
87
-
88
-
89
-
90
-
91
-
92
-
93
-
94
-
95
-
96
-
97
-
98
-
99
-
100
-
101
-
 102
102 -
 103
103 -
 104
104 -
 105
105 -
 106
106 -
 107
107 -
 108
108 -
 109
109 -
 110
110 -
 111
111 -
 112
112 -
 113
113 -
 114
114 -
 115
115 -
 116
116 -
 117
117 -
 118
118 -
 119
119 -
 120
120 -
 121
121 -
 122
122 -
123
-
124
-
125
-
126
-
127
-
128
-
129
-
130
-
131
-
132
-
133
-
134
-
135
-
136
-
137
-
138
-
139
-
140
-
141
-
142
-
143
-
144
-
145
-
146
-
147
-
148
-
149
-
150
-
151
-
152
-
153
-
154
 |
 |

Table of Contents
DELL INC.
NOTES TO CONSOLIDATED FINANCIAL STATEMENTS (Continued)
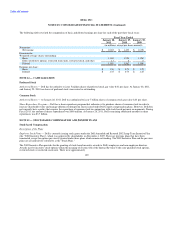
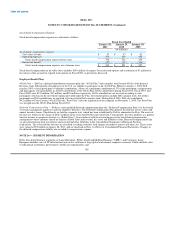
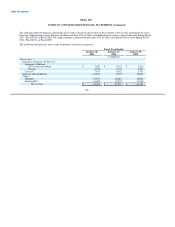
The allocation between domestic and foreign net revenue is based on the location of the customers. Net revenue and long-lived assets
from any single foreign country did not constitute more than 10% of Dell's consolidated net revenues or long-lived assets during Fiscal
2011, Fiscal 2010, or Fiscal 2009. No single customer accounted for more than 10% of Dell's consolidated net revenue during Fiscal
2011, Fiscal 2010, or Fiscal 2009.
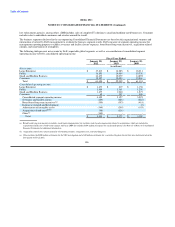
The following table presents net revenue by product and services categories:
Fiscal Year Ended
January 28, January 29, January 30,
2011 2010 2009
(in millions)
Net revenue:
Enterprise Solutions and Services:
Enterprise Solutions:
Servers and networking $ 7,609 $ 6,032 $ 6,512
Storage 2,295 2,192 2,667
Services 7,673 5,622 5,351
Software and peripherals 10,261 9,499 10,603
Client:
Mobility 18,971 16,610 18,604
Desktop PCs 14,685 12,947 17,364
Net revenue $ 61,494 $ 52,902 $ 61,101
108