Dell 2010 Annual Report Download - page 43
Download and view the complete annual report
Please find page 43 of the 2010 Dell annual report below. You can navigate through the pages in the report by either clicking on the pages listed below, or by using the keyword search tool below to find specific information within the annual report.-
 1
1 -
2
-
3
-
4
-
5
-
6
-
7
-
8
-
9
-
10
-
11
-
12
-
13
-
14
-
15
-
16
-
17
-
18
-
19
-
20
-
21
-
22
-
23
-
24
-
25
-
26
-
27
-
28
-
29
-
30
-
31
-
32
-
 33
33 -
 34
34 -
 35
35 -
 36
36 -
 37
37 -
 38
38 -
 39
39 -
 40
40 -
 41
41 -
 42
42 -
 43
43 -
 44
44 -
 45
45 -
 46
46 -
 47
47 -
 48
48 -
 49
49 -
 50
50 -
 51
51 -
 52
52 -
 53
53 -
54
-
55
-
56
-
57
-
58
-
59
-
60
-
61
-
62
-
63
-
64
-
65
-
66
-
67
-
68
-
69
-
70
-
71
-
72
-
73
-
74
-
75
-
76
-
77
-
78
-
79
-
80
-
81
-
82
-
83
-
84
-
85
-
86
-
87
-
88
-
89
-
90
-
91
-
92
-
93
-
94
-
95
-
96
-
97
-
98
-
99
-
100
-
101
-
102
-
103
-
104
-
105
-
106
-
107
-
108
-
109
-
110
-
111
-
112
-
113
-
114
-
115
-
116
-
117
-
118
-
119
-
120
-
121
-
122
-
123
-
124
-
125
-
126
-
127
-
128
-
129
-
130
-
131
-
132
-
133
-
134
-
135
-
136
-
137
-
138
-
139
-
140
-
141
-
142
-
143
-
144
-
145
-
146
-
147
-
148
-
149
-
150
-
151
-
152
-
153
-
154
 |
 |

Table of Contents
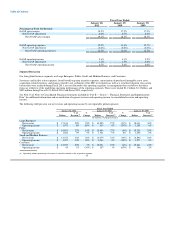
year-over-year, though average selling prices increased 6% year-over-year, driven by improved product mix toward our
new product lines.
• Storage — All Commercial segments contributed to the year-over-year decrease in storage revenue during Fiscal 2010. Dell
EqualLogic performed strongly with year-over-year revenue growth of 45%.
• Services — Services revenue increased year-over-year during Fiscal 2010 with revenue from Perot Systems contributing
$588 million of the increase. Without the contribution by Perot Systems, services revenue would have decreased 6%. A
significant portion of Dell's services is made up of support services, which tend to correlate with hardware unit growth.
Therefore, excluding the impact of Perot Systems, our declines in unit shipments contributed to the year-over-year services
revenue decline. Perot Systems primarily impacted our Public and Large Enterprise segments, with $418 million and
$160 million in services revenue, respectively. Our deferred services revenue balance increased 6.5% year-over-year to
$6.1 billion at January 29, 2010.
– Software and Peripherals — The decline in S&P revenue was driven by overall customer unit shipment declines and demand softness
in displays, imaging products, and electronics, which experienced year-over-year revenue decreases of 27%,20%, and 9%,
respectively, for Fiscal 2010 . We saw growth in software licensing, with revenue improvement of 5% during Fiscal 2010. All
segments experienced year-over-year revenue declines during Fiscal 2010, except for Public, which experienced year-over-year S&P
revenue growth of 5%.
– Client
• Mobility — Revenue from mobility products declined during Fiscal 2010 even though unit shipments increased 7% over Fiscal
2009 due to an industry mix shift to lower priced mobility product offerings. The unit increase was primarily driven by a 32%
year-over-year increase in Consumer units, while Commercial units declined 12% for the same period. Overall, Consumer
mobility revenue increased 4% year-over-year, while Commercial declined 20%.
• Desktop PCs — During Fiscal 2010, revenue from desktop PCs decreased on unit declines of 17%. In the marketplace, we saw
rising end-user demand for mobility products, which contributed to further slowing demand for desktop PCs. The decline in
desktop PC revenue was also due to the on-going competitive pricing pressure for lower priced desktops and the slowdown in
global IT end-user demand during Fiscal 2010. Consequently, our average selling price for desktops decreased 11%
year-over-year as we aligned our prices and product offerings with the marketplace. During Fiscal 2010, desktop revenue
decreased across all segments.
Stock-Based Compensation
We use our 2002 Long-Term Incentive Plan, amended in December 2007, for stock-based incentive awards. These awards can be in the
form of stock options, stock appreciation rights, stock bonuses, restricted stock, restricted stock units, performance units, or performance
shares. Stock-based compensation expense totaled $332 million for Fiscal 2011, compared to $312 million and $418 million for Fiscal
2010 and Fiscal 2009, respectively. Stock-based compensation expense for Fiscal 2009 included $104 million of expense for accelerated
options. For further discussion on stock-based compensation, see Note 15 of Notes to Consolidated Financial Statements included in
"Part II — Item 8 — Financial Statements and Supplementary Data."
39