Dell 2010 Annual Report Download - page 62
Download and view the complete annual report
Please find page 62 of the 2010 Dell annual report below. You can navigate through the pages in the report by either clicking on the pages listed below, or by using the keyword search tool below to find specific information within the annual report.-
 1
1 -
2
-
3
-
4
-
5
-
6
-
7
-
8
-
9
-
10
-
11
-
12
-
13
-
14
-
15
-
16
-
17
-
18
-
19
-
20
-
21
-
22
-
23
-
24
-
25
-
26
-
27
-
28
-
29
-
30
-
31
-
32
-
33
-
34
-
35
-
36
-
37
-
38
-
39
-
40
-
41
-
42
-
43
-
44
-
45
-
46
-
47
-
48
-
49
-
50
-
51
-
 52
52 -
 53
53 -
 54
54 -
 55
55 -
 56
56 -
 57
57 -
 58
58 -
 59
59 -
 60
60 -
 61
61 -
 62
62 -
 63
63 -
 64
64 -
 65
65 -
 66
66 -
 67
67 -
 68
68 -
 69
69 -
 70
70 -
 71
71 -
 72
72 -
73
-
74
-
75
-
76
-
77
-
78
-
79
-
80
-
81
-
82
-
83
-
84
-
85
-
86
-
87
-
88
-
89
-
90
-
91
-
92
-
93
-
94
-
95
-
96
-
97
-
98
-
99
-
100
-
101
-
102
-
103
-
104
-
105
-
106
-
107
-
108
-
109
-
110
-
111
-
112
-
113
-
114
-
115
-
116
-
117
-
118
-
119
-
120
-
121
-
122
-
123
-
124
-
125
-
126
-
127
-
128
-
129
-
130
-
131
-
132
-
133
-
134
-
135
-
136
-
137
-
138
-
139
-
140
-
141
-
142
-
143
-
144
-
145
-
146
-
147
-
148
-
149
-
150
-
151
-
152
-
153
-
154
 |
 |
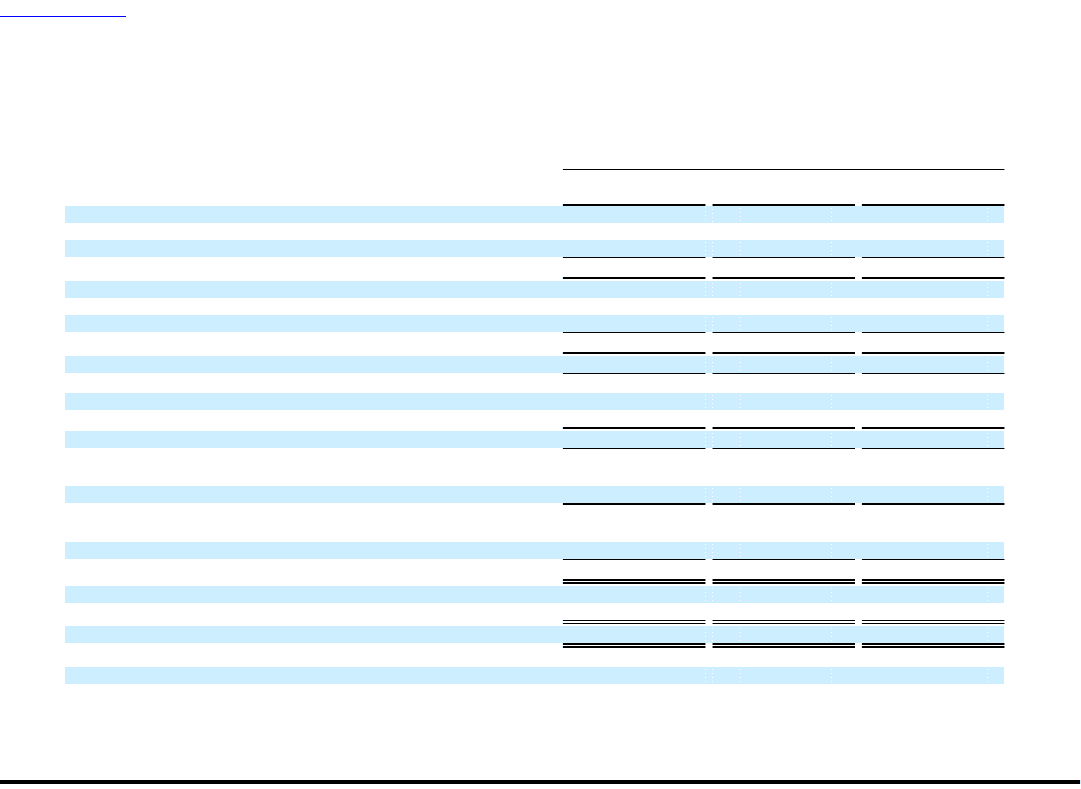
Table of Contents
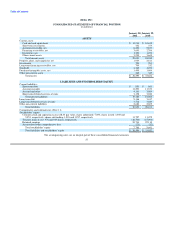
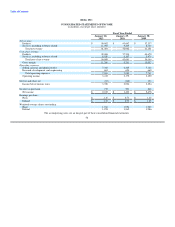
DELL INC.
CONSOLIDATED STATEMENTS OF INCOME
(in millions, except per share amounts)
Fiscal Year Ended
January 28, January 29, January 30,
2011 2010 2009
Net revenue:
Products $ 50,002 $ 43,697 $ 52,337
Services, including software related 11,492 9,205 8,764
Total net revenue 61,494 52,902 61,101
Cost of net revenue:
Products 42,068 37,534 44,670
Services, including software related 8,030 6,107 5,474
Total cost of net revenue 50,098 43,641 50,144
Gross margin 11,396 9,261 10,957
Operating expenses:
Selling, general, and administrative 7,302 6,465 7,102
Research, development, and engineering 661 624 665
Total operating expenses 7,963 7,089 7,767
Operating income 3,433 2,172 3,190
Interest and other, net (83) (148) 134
Income before income taxes 3,350 2,024 3,324
Income tax provision 715 591 846
Net income $ 2,635 $ 1,433 $ 2,478
Earnings per share:
Basic $ 1.36 $ 0.73 $ 1.25
Diluted $ 1.35 $ 0.73 $ 1.25
Weighted-average shares outstanding:
Basic 1,944 1,954 1,980
Diluted 1,955 1,962 1,986
The accompanying notes are an integral part of these consolidated financial statements.
58