Dell 2010 Annual Report Download - page 30
Download and view the complete annual report
Please find page 30 of the 2010 Dell annual report below. You can navigate through the pages in the report by either clicking on the pages listed below, or by using the keyword search tool below to find specific information within the annual report.-
 1
1 -
2
-
3
-
4
-
5
-
6
-
7
-
8
-
9
-
10
-
11
-
12
-
13
-
14
-
15
-
16
-
17
-
18
-
19
-
 20
20 -
 21
21 -
 22
22 -
 23
23 -
 24
24 -
 25
25 -
 26
26 -
 27
27 -
 28
28 -
 29
29 -
 30
30 -
 31
31 -
 32
32 -
 33
33 -
 34
34 -
 35
35 -
 36
36 -
 37
37 -
 38
38 -
 39
39 -
 40
40 -
41
-
42
-
43
-
44
-
45
-
46
-
47
-
48
-
49
-
50
-
51
-
52
-
53
-
54
-
55
-
56
-
57
-
58
-
59
-
60
-
61
-
62
-
63
-
64
-
65
-
66
-
67
-
68
-
69
-
70
-
71
-
72
-
73
-
74
-
75
-
76
-
77
-
78
-
79
-
80
-
81
-
82
-
83
-
84
-
85
-
86
-
87
-
88
-
89
-
90
-
91
-
92
-
93
-
94
-
95
-
96
-
97
-
98
-
99
-
100
-
101
-
102
-
103
-
104
-
105
-
106
-
107
-
108
-
109
-
110
-
111
-
112
-
113
-
114
-
115
-
116
-
117
-
118
-
119
-
120
-
121
-
122
-
123
-
124
-
125
-
126
-
127
-
128
-
129
-
130
-
131
-
132
-
133
-
134
-
135
-
136
-
137
-
138
-
139
-
140
-
141
-
142
-
143
-
144
-
145
-
146
-
147
-
148
-
149
-
150
-
151
-
152
-
153
-
154
 |
 |

Table of Contents
benefit from decreasing component costs, particularly for memory and displays. We expect this favorable component cost
environment will moderate in the first half of Fiscal 2012.
• Services, including software related — During Fiscal 2011, our services gross margin increased in absolute dollars compared to the
prior fiscal year, although our gross margin percentage decreased. The decrease in gross margin percentage for services, including
software related was primarily due to a higher mix of outsourcing and project-related services. Our gross margin rate for services,
including software related, is driven by our transactional services, which consist primarily of our extended warranty sales, offset by
lower margin categories such as outsourcing and project-related services. Our extended warranty services are more profitable because
we sell extended warranty offerings directly to customers rather than through a distribution channel.
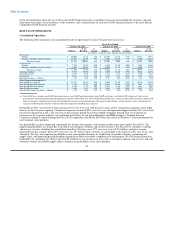
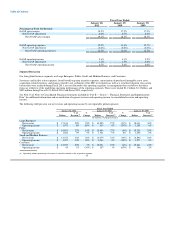
Total gross margin for Fiscal 2011 increased 23% to $11.4 billion on a GAAP basis and 22% to $11.7 billion on a non-GAAP basis from
Fiscal 2010. Gross margin on a GAAP basis for Fiscal 2011 and Fiscal 2010 includes the effects of amortization of intangible assets,
severance and facility action costs, and acquisition-related charges. As set forth in the reconciliation under "Non-GAAP Financial
Measures" below, these items are excluded from the calculation of non-GAAP gross margin for Fiscal 2011 and Fiscal 2010.
Amortization of intangible assets included in gross margin increased 84% to $278 million for Fiscal 2011. The increase in amortization of
intangibles for Fiscal 2011 was primarily due to an increase in intangible assets of $1.2 billion in Fiscal 2010 related to our acquisition of
Perot Systems. Severance and facility action costs included in gross margin decreased 78% to $53 million during Fiscal 2011. The
decrease in severance and facility action costs was due to a decrease in cost reduction activities from Fiscal 2010. While we believe that
we have completed a significant portion of our manufacturing transformation, we expect to implement additional cost reduction measures
depending on a number of factors, including end-user demand for our products and services and the continued simplification of our sales
organizations and supply and logistics chain. Additional cost reduction measures may include selected headcount reductions, as well as
other cost reduction programs.
Fiscal 2010 compared to Fiscal 2009
• Products — Product gross margin decreased in absolute dollars and in gross margin percentage during Fiscal 2010. The decline in
gross margin dollars was attributable to softer demand, change in sales mix, and lower average selling prices. Additionally, during
Fiscal 2010, gross margins were negatively impacted by component cost pressures.
• Services, including software related — During Fiscal 2010, our services gross margin decreased in absolute dollars compared to the
prior fiscal year with a corresponding decrease in gross margin percentage. Our solution services offerings faced competitive pricing
pressures, resulting in lower gross margin percentages.
Total gross margin for Fiscal 2010 decreased 15% to $9.3 billion on a GAAP basis and 14% to $9.6 billion on a non-GAAP basis from
Fiscal 2009. Gross margin on a GAAP basis for Fiscal 2010 includes the effects of severance and facility action costs, amortization of
intangible assets, and acquisition-related charges. Gross margin on a GAAP basis for Fiscal 2009 includes the effects of severance and
facility action costs, amortization of intangible assets, and stock option accelerated vesting charges. As set forth in the reconciliation
under "Non-GAAP Financial Measures" below, these items are excluded from the calculation of non-GAAP gross margin for Fiscal 2010
and Fiscal 2009. Amortization of intangible assets included in gross margin increased 156% to $151 million for Fiscal 2010. The increase
in amortization of intangibles for Fiscal 2010 was primarily due to an increase in intangible assets from our acquisition of Perot Systems
in Fiscal 2010 discussed above. Severance and facility action costs included in gross margin increased 62% to $236 million during Fiscal
2010 due to our migration to contract manufacturers and closures of certain manufacturing facilities. For Fiscal 2009, we incurred
$104 million in certain stock-based compensation charges related to accelerated options that had an exercise price greater than the current
market stock price. Included in gross margin on a GAAP basis is $16 million from these stock option accelerated vesting charges, which
are excluded from the calculation of our non-GAAP gross margin. We did not have any accelerated stock option expenses in Fiscal 2010.
26