Costco 2014 Annual Report Download - page 63
Download and view the complete annual report
Please find page 63 of the 2014 Costco annual report below. You can navigate through the pages in the report by either clicking on the pages listed below, or by using the keyword search tool below to find specific information within the annual report.-
 1
1 -
2
-
3
-
4
-
5
-
6
-
7
-
8
-
9
-
10
-
11
-
12
-
13
-
14
-
15
-
16
-
17
-
18
-
19
-
20
-
21
-
22
-
23
-
24
-
25
-
26
-
27
-
28
-
29
-
30
-
31
-
32
-
33
-
34
-
35
-
36
-
37
-
38
-
39
-
40
-
41
-
42
-
43
-
44
-
45
-
46
-
47
-
48
-
49
-
50
-
51
-
52
-
 53
53 -
 54
54 -
 55
55 -
 56
56 -
 57
57 -
 58
58 -
 59
59 -
 60
60 -
 61
61 -
 62
62 -
 63
63 -
 64
64 -
 65
65 -
 66
66 -
 67
67 -
 68
68 -
 69
69 -
 70
70 -
 71
71 -
 72
72 -
 73
73 -
74
-
75
-
76
 |
 |

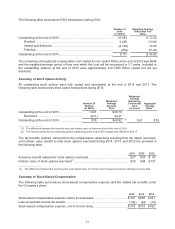
The following table summarizes RSU transactions during 2014:
Number of
Units
(
in 000’s
)
Weighted-Average
Grant Date Fair
Value
Outstandin
g
at the end of 2013 ........................................................................
.
10,081
$ 72.52
Granted ........................................................................................................
.
3,456
113.64
Vested and delivered ..................................................................................
.
(
4,166
)
72.45
Forfeited .......................................................................................................
.
(
254
)
81.04
Outstandin
g
at the end of 2014 ........................................................................
.
9,117
$ 86.92
The remaining unrecognized compensation cost related to non-vested RSUs at the end of 2014 was $548
and the weighted-average period of time over which this cost will be recognized is 1.7 years. Included in
the outstanding balance at the end of 2014 were approximately 2,811,000 RSUs vested but not yet
delivered.
Summary of Stock Option Activity
All outstanding stock options were fully vested and exercisable at the end of 2014 and 2013. The
following table summarizes stock option transactions during 2014:
Number Of
Options
(
in 000’s
)
Weighted-
Average
Exercise
Price
Weighted-
Average
Remaining
Contractual
Term
(
in
y
ears
)
Aggregate
Intrinsic
Value(1)
Outstandin
g
at the end of 2013 ...............................
.
1,947 $39.70
Exercised ............................................................
.
(
971
)
38.47
Outstandin
g
at the end of 2014 ...............................
.
976
$
40.92 (2) 0.61 $78
_______________
(1) The difference between the exercise price and market value of common stock at the end of 2014.
(2) The exercise prices for the remaining options outstanding at the end of 2014 ranged from $40.69 to $43.17.
The tax benefits realized, derived from the compensation deductions resulting from the option exercises,
and intrinsic value related to total stock options exercised during 2014, 2013, and 2012 are provided in
the following table:
2014 2013 2012
A
ctual tax benefit realized for stock o
p
tions exercised ..................................................... $ 27
$ 33 $ 50
Intrinsic value of stock options exercised(1) ......................................................................... $ 76
$ 94 $137
_______________
(1) The difference between the exercise price and market value of common stock measured at each individual exercise date.
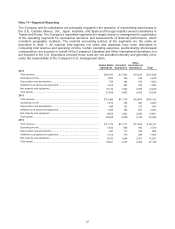
Summary of Stock-Based Compensation
The following table summarizes stock-based compensation expense and the related tax benefits under
the Company’s plans:
2014 2013 2012
Stock-based com
p
ensation ex
p
ense before income taxes ..............................................$ 327
$
285
$
241
Less recognized income tax benefit .....................................................................................
(
109
)
(
94
)
(
79
)
Stock-based com
p
ensation ex
p
ense, net of income taxes...............................................$ 218
$
191
$
162
61