Costco 2014 Annual Report Download - page 58
Download and view the complete annual report
Please find page 58 of the 2014 Costco annual report below. You can navigate through the pages in the report by either clicking on the pages listed below, or by using the keyword search tool below to find specific information within the annual report.-
 1
1 -
2
-
3
-
4
-
5
-
6
-
7
-
8
-
9
-
10
-
11
-
12
-
13
-
14
-
15
-
16
-
17
-
18
-
19
-
20
-
21
-
22
-
23
-
24
-
25
-
26
-
27
-
28
-
29
-
30
-
31
-
32
-
33
-
34
-
35
-
36
-
37
-
38
-
39
-
40
-
41
-
42
-
43
-
44
-
45
-
46
-
47
-
 48
48 -
 49
49 -
 50
50 -
 51
51 -
 52
52 -
 53
53 -
 54
54 -
 55
55 -
 56
56 -
 57
57 -
 58
58 -
 59
59 -
 60
60 -
 61
61 -
 62
62 -
 63
63 -
 64
64 -
 65
65 -
 66
66 -
 67
67 -
 68
68 -
69
-
70
-
71
-
72
-
73
-
74
-
75
-
76
 |
 |

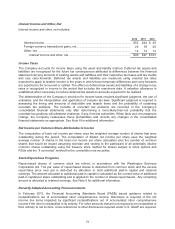
Gross unrealized gains and losses on available-for-sale securities were not material in 2014, 2013, and
2012. At the end of 2014 and 2012, the Company's available-for-sale securities that were in a continuous
unrealized-loss position were not material, and at the end of 2013, the Company had none. There were
no gross unrealized gains and losses on cash equivalents at the end of 2014 and 2013, and these
amounts were not material at the end of 2012.
The proceeds from sales of available-for-sale securities were $116, $244, and $482 during 2014, 2013,
and 2012, respectively. Gross realized gains or losses from sales of available-for-sale securities were not
material in 2014, 2013, and 2012.
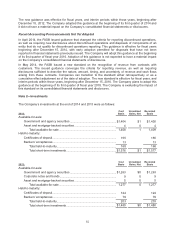
The maturities of available-for-sale and held-to-maturity securities at the end of 2014, were as follows:
Available-For-Sale
Held-To-Maturit
y
Cost Basis Fair Value
Due in one
y
ear or less ..................................................................... $148 $ 14 $ 168
Due after one year through five years ............................................ 1,226 1,227
0
Due after five years ............................................................................ 34 34
0
Total ..............................................................................................
$
1,408 $1,409
$ 168
Note 3—Fair Value Measurement
Assets and Liabilities Measured at Fair Value on a Recurring Basis
The tables below present information at the end of 2014 and 2013, respectively, regarding the Company’s
financial assets and financial liabilities that are measured at fair value on a recurring basis and indicate
the level within the fair value hierarchy reflecting the valuation techniques utilized to determine such fair
value.
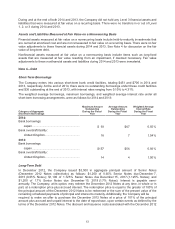
2014: Level 1 Level 2
Mone
y
market mutual funds
(1)
.................................................................................................
$
312
$
0
Investment in government and agency securities ................................................................ 0 1,405
Investment in asset and mortgage-backed securities......................................................... 04
Forward foreign-exchange contracts, in asset position(2) .................................................... 03
Forward foreign-exchange contracts, in (liability) position(2) .............................................. 0
(
3
)
Total ..................................................................................................................................... $ 312 $1,409
2013: Level Level 2
Mone
y
market mutual funds
(1)
................................................................................................. $ 8
$
0
Investment in government and agency securities ................................................................ 0 1,263
Investment in corporate notes and bonds............................................................................. 09
Investment in asset and mortgage-backed securities ......................................................... 05
Forward foreign-exchange contracts, in asset position(2) .................................................... 03
Forward foreign-exchange contracts, in (liability) position(2) .............................................. 0
(
3
)
Total ..................................................................................................................................... $
8$1,277
_______________
(1) Included in cash and cash equivalents in the accompanying consolidated balance sheets.
(2) The asset and the liability values are included in deferred income taxes and other current assets and other current liabilities,
respectively, in the accompanying consolidated balance sheets. See Note 1 for additional information on derivative
instruments.
56