Costco 2014 Annual Report Download - page 47
Download and view the complete annual report
Please find page 47 of the 2014 Costco annual report below. You can navigate through the pages in the report by either clicking on the pages listed below, or by using the keyword search tool below to find specific information within the annual report.-
 1
1 -
2
-
3
-
4
-
5
-
6
-
7
-
8
-
9
-
10
-
11
-
12
-
13
-
14
-
15
-
16
-
17
-
18
-
19
-
20
-
21
-
22
-
23
-
24
-
25
-
26
-
27
-
28
-
29
-
30
-
31
-
32
-
33
-
34
-
35
-
36
-
 37
37 -
 38
38 -
 39
39 -
 40
40 -
 41
41 -
 42
42 -
 43
43 -
 44
44 -
 45
45 -
 46
46 -
 47
47 -
 48
48 -
 49
49 -
 50
50 -
 51
51 -
 52
52 -
 53
53 -
 54
54 -
 55
55 -
 56
56 -
 57
57 -
58
-
59
-
60
-
61
-
62
-
63
-
64
-
65
-
66
-
67
-
68
-
69
-
70
-
71
-
72
-
73
-
74
-
75
-
76
 |
 |

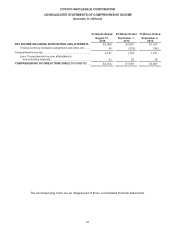
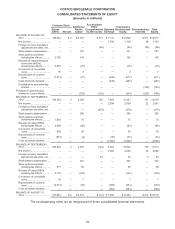
COSTCO WHOLESALE CORPORATION
CONSOLIDATED STATEMENTS OF CASH FLOWS
(amounts in millions)
52 Weeks
Ended 52 Weeks
Ended
53 Weeks
Ended
August 31,
2014 September 1,
2013
September 2,
2012
CASH FLOWS FROM OPERATING ACTIVITIES
Net income including noncontrolling interests .................................................................
.
$2,088 $ 2,061
$1,767
Adjustments to reconcile net income including noncontrolling interests to net cash
p
rovided b
y
o
p
eratin
g
activities:
Depreciation and amortization ..................................................................................
.
1,029 946
908
Stock-based compensation ......................................................................................
.
327 285
241
Excess tax benefits on stock-based awards ...............................................................
.
(
84
)
(
61
)
(
64
)
Other non-cash operating activities, net ....................................................................
.
22
(
7
)
28
Deferred income taxes ............................................................................................
.
(
63
)
7
(
3
)
Chan
g
es in operatin
g
assets and liabilities:
Increase in merchandise inventories ........................................................................
.
(
563
)
(
898
)
(
490
)
Increase in accounts payable .................................................................................
.
529 718
338
Other operating assets and liabilities, net .................................................................
.
699 386
332
Net cash provided by operating activities .................................................................
.
3,984 3,437
3,057
CASH FLOWS FROM INVESTING ACTIVITIES
Purchases of short-term investments ............................................................................
.
(
2,503
)
(
2,572
)
(
2,048
)
Maturities and sales of short-term investments ...............................................................
.
2,406 2,385
2,303
Additions to property and equipment .............................................................................
.
(
1,993
)
(
2,083
)
(
1,480
)
Other investing activities, net .......................................................................................
.
(
3
)
19
(
11
)
Net cash used in investing activities ........................................................................
.
(
2,093
)
(
2,251
)
(
1,236
)
CASH FLOWS FROM FINANCING ACTIVITIES
Change in bank checks outstanding ..............................................................................
.
96
(
70
)
457
Repayments of short-term borrowings ...........................................................................
.
(
103
)
(
287
)
(
114
)
Proceeds from short-term borrowings ...........................................................................
.
68 326
114
Proceeds from issuance of long-term debt .....................................................................
.
117 3,717
130
Repayments of long-term debt .....................................................................................
.
0 0
(
900
)
Distribution to noncontrolling interests ...........................................................................
.
0
(
22
)
(
161
)
Proceeds from exercise of stock options ........................................................................
.
38 52
109
Minimum tax withholdings on stock-based awards ..........................................................
.
(
164
)
(
121
)
(
107
)
Excess tax benefits on stock-based awards ...................................................................
.
84 61
64
Repurchases of common stock ....................................................................................
.
(
334
)
(
36
)
(
632
)
Cash dividend payments .............................................................................................
.
(
584
)
(
3,560
)
(
446
)
Purchase of noncontrolling interest in Costco Mexico ......................................................
.
0 0
(
789
)
Other financing activities, net .......................................................................................
.
(
4
)
(
16
)
(
6
)
Net cash (used in) provided by financing activities ....................................................
.
(
786
)
44
(
2,281
)
EFFECT OF EXCHANGE RATE CHANGES ON CASH AND CASH EQUIVALENTS ...........
.
(
11
)
(
114
)
(
21
)
Net increase (decrease) in cash and cash equivalents ....................................................
.
1,094 1,116
(
481
)
CASH AND CASH EQUIVALENTS BEGINNING OF YEAR...............................................
.
4,644 3,528
4,009
CASH AND CASH EQUIVALENTS END OF YEAR ..........................................................
.
$
5,738 $ 4,644
$
3,528
SUPPLEMENTAL DISCLOSURE OF CASH FLOW INFORMATION:
Cash
p
aid durin
g
the
y
ear for:
Interest (reduced by $11, $12 and $10, interest capitalized in 2014, 2013 and 2012,
respectively) ......................................................................................................
.
$
109
$
86
$
112
Income taxes, net ..................................................................................................
.
$
869
$
1,001
$
956
The accompanying notes are an integral part of these consolidated financial statements.
45