Costco 2014 Annual Report Download - page 28
Download and view the complete annual report
Please find page 28 of the 2014 Costco annual report below. You can navigate through the pages in the report by either clicking on the pages listed below, or by using the keyword search tool below to find specific information within the annual report.-
 1
1 -
2
-
3
-
4
-
5
-
6
-
7
-
8
-
9
-
10
-
11
-
12
-
13
-
14
-
15
-
16
-
17
-
 18
18 -
 19
19 -
 20
20 -
 21
21 -
 22
22 -
 23
23 -
 24
24 -
 25
25 -
 26
26 -
 27
27 -
 28
28 -
 29
29 -
 30
30 -
 31
31 -
 32
32 -
 33
33 -
 34
34 -
 35
35 -
 36
36 -
 37
37 -
 38
38 -
39
-
40
-
41
-
42
-
43
-
44
-
45
-
46
-
47
-
48
-
49
-
50
-
51
-
52
-
53
-
54
-
55
-
56
-
57
-
58
-
59
-
60
-
61
-
62
-
63
-
64
-
65
-
66
-
67
-
68
-
69
-
70
-
71
-
72
-
73
-
74
-
75
-
76
 |
 |
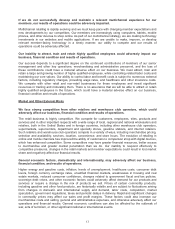
margins, modest changes in various items in the income statement, particularly gross margin and selling,
general and administrative expenses, can have substantial impacts on net income.
Our operating model is generally the same across our U.S., Canada, and Other International operating
segments (see Note 11 to the consolidated financial statements included in this Report). Certain countries
in the Other International segment have relatively higher rates of square footage growth, lower wages and
benefit costs as a percentage of country sales, and/or less direct membership warehouse competition.
Additionally, we operate our gasoline business only in the U.S., Canada, Australia, and U.K.
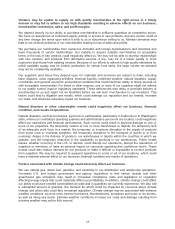
In discussions of our consolidated operating results, we refer to the impact of changes in foreign
currencies relative to the U.S. dollar, which are references to the differences between the foreign-
exchange rates we use to convert the financial results of our international operations from local currencies
into U.S. dollars for financial reporting purposes. This impact of foreign-exchange rate changes is
calculated based on the difference between the current period's currency exchange rates and the
comparable prior-year period's currency exchange rates.
Our fiscal year ends on the Sunday closest to August 31. Fiscal years 2014 and 2013 were 52-week fiscal
years ending on August 31, 2014, and September 1, 2013, respectively, while fiscal year 2012 was a 53-
week fiscal year ending on September 2, 2012. Certain percentages presented are calculated using
actual results prior to rounding. Unless otherwise noted, references to net income relate to net income
attributable to Costco.
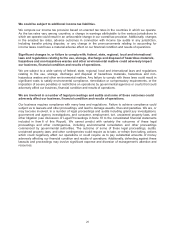
Highlights for fiscal year 2014 included:
• We opened 30 new warehouses in 2014, 17 in the U.S., 3 in Canada, and 10 in our Other
International segment, compared to 26 new warehouses in 2013;
• Net sales increased 7% to $110,212, driven by a 4% increase in comparable sales and sales at
warehouses opened in 2013 and 2014. Net and comparable sales were negatively impacted by
changes in certain foreign currencies relative to the U.S. dollar;
• Membership fees increased 6% to $2,428, primarily due to membership sign-ups at existing and
new warehouses and executive membership upgrades, partially offset by the negative impact of
changes in certain foreign currencies relative to the U.S. dollar;
• Gross margin (net sales less merchandise costs) as a percentage of net sales increased four basis
points;
• Selling, general and administrative (SG&A) expenses as a percentage of net sales increased
seven basis points, primarily due to continued investment in modernizing our information systems;
• Net income in 2014 increased to $2,058, or $4.65 per diluted share compared to $2,039, or $4.63
per diluted share in 2013. The prior year results were positively impacted by a $62 tax benefit, or
$0.14 per diluted share, in connection with the special cash dividend paid to the Company's 401(k)
Plan participants;
• Changes in foreign currencies relative to the U.S. dollar adversely impacted diluted earnings per
share by $0.10, primarily due to changes in the Canadian dollar; and
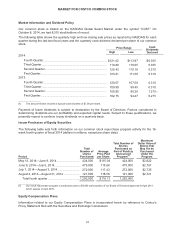
• The Board of Directors approved an increase in the quarterly cash dividend from $0.31 to $0.355
per share in April 2014.
26