Costco 2014 Annual Report Download - page 31
Download and view the complete annual report
Please find page 31 of the 2014 Costco annual report below. You can navigate through the pages in the report by either clicking on the pages listed below, or by using the keyword search tool below to find specific information within the annual report.-
 1
1 -
2
-
3
-
4
-
5
-
6
-
7
-
8
-
9
-
10
-
11
-
12
-
13
-
14
-
15
-
16
-
17
-
18
-
19
-
20
-
 21
21 -
 22
22 -
 23
23 -
 24
24 -
 25
25 -
 26
26 -
 27
27 -
 28
28 -
 29
29 -
 30
30 -
 31
31 -
 32
32 -
 33
33 -
 34
34 -
 35
35 -
 36
36 -
 37
37 -
 38
38 -
 39
39 -
 40
40 -
 41
41 -
42
-
43
-
44
-
45
-
46
-
47
-
48
-
49
-
50
-
51
-
52
-
53
-
54
-
55
-
56
-
57
-
58
-
59
-
60
-
61
-
62
-
63
-
64
-
65
-
66
-
67
-
68
-
69
-
70
-
71
-
72
-
73
-
74
-
75
-
76
 |
 |

impact as a result of higher sales penetration. Warehouse ancillary and other businesses gross margin
when expressed as a percentage of net sales increased by six basis points. Gross margin as a
percentage of net sales was negatively impacted by seven basis points primarily due to a $28 LIFO
inventory charge in 2014 compared to a $27 benefit in 2013 and a nonrecurring legal settlement that
increased gross margin in 2013. The LIFO charge resulted from higher costs for our merchandise
inventories, primarily our foods and fresh foods categories. Excluding the effect of gasoline price deflation
on net sales, gross margin as a percentage of net sales increased one basis point. Changes in foreign
currencies relative to the U.S. dollar negatively impacted gross margin by $151 in 2014.
Gross margin in our core merchandise categories when expressed as a percentage of their own
merchandise category sales increased seven basis points. The changes in the individual merchandise
categories are consistent with the discussion above.
When expressed as a percentage of the segment's own sales, gross margin increased in our U.S.
operations, primarily due to our softlines and food and sundries categories, partially offset by a decrease
in hardlines and the LIFO charge and legal settlement discussed above. The gross margin percentage in
our Canadian operations decreased, primarily due to decreases in hardlines and food and sundries,
partially offset by an increase in fresh foods. The gross margin percentage in our Other International
segment increased, primarily due to fresh foods.
2013 vs. 2012
Gross margin as a percentage of net sales increased seven basis points. Gross margin in our core
merchandise categories when expressed as a percentage of net sales decreased four basis points,
primarily due to a decrease in fresh foods as a result of our continued investment in merchandise pricing.
Warehouse ancillary and other businesses gross margin when expressed as a percentage of net sales
increased by six basis points, predominately in our optical and hearing aid businesses. Additionally, gross
margin was positively impacted by five basis points due to a $27 LIFO inventory benefit in 2013,
compared to a charge of $21 in 2012, and two basis points due to a legal settlement. The LIFO benefit
resulted from lower costs for our merchandise inventories, primarily hardlines. Executive Membership 2%
reward program negatively impacted gross margin by two basis points, due to increased spending by
Executive Members.
Gross margin for core merchandise categories when expressed as a percentage of core merchandise
sales (rather than total net sales) decreased two basis points, primarily due to a decrease in fresh foods.
When expressed as a percentage of the segment’s own sales, gross margin increased in our U.S.
operations primarily due to improvements in warehouse ancillary and other businesses. The LIFO benefit
and legal settlement also benefited our U.S. operations. These improvements were slightly offset by a
decrease in fresh foods. The gross margin percentage in our Canadian operations was flat, resulting from
a decrease in fresh foods, offset by increases in warehouse ancillary and other businesses. The gross
margin percentage in our Other International segment decreased, primarily in fresh foods.
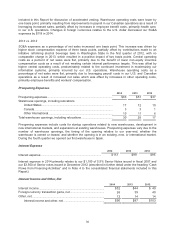
Selling, General and Administrative Expenses
2014 2013 2012
SG&A ex
p
enses .................................................................................. $10,899 $10,104
$9,518
SG&A expenses as a percentage of net sales ............................... 9.89 % 9.82 % 9.81%
2014 vs. 2013
SG&A expenses as a percentage of net sales increased seven basis points. Excluding the effect of
gasoline price deflation on net sales, SG&A expenses as a percentage of net sales increased four basis
points. This increase was largely due to an increase in central operating costs of three basis points
primarily due to continued investment in modernizing our information systems, primarily incurred by our
U.S. operations. Stock compensation expense was also higher by two basis points due to accelerated
vesting for long service and appreciation in the trading price of our stock, despite a 14% reduction in the
average number of RSUs granted to each participant. See Note 1 to the consolidated financial statements
29