Costco 2014 Annual Report Download - page 11
Download and view the complete annual report
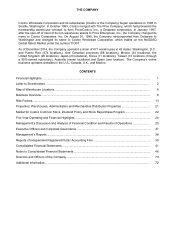
Please find page 11 of the 2014 Costco annual report below. You can navigate through the pages in the report by either clicking on the pages listed below, or by using the keyword search tool below to find specific information within the annual report.-
 1
1 -
 2
2 -
 3
3 -
 4
4 -
 5
5 -
 6
6 -
 7
7 -
 8
8 -
 9
9 -
 10
10 -
 11
11 -
 12
12 -
 13
13 -
 14
14 -
 15
15 -
 16
16 -
 17
17 -
 18
18 -
 19
19 -
 20
20 -
 21
21 -
 22
22 -
23
-
24
-
25
-
26
-
27
-
28
-
29
-
30
-
31
-
32
-
33
-
34
-
35
-
36
-
37
-
38
-
39
-
40
-
41
-
42
-
43
-
44
-
45
-
46
-
47
-
48
-
49
-
50
-
51
-
52
-
53
-
54
-
55
-
56
-
57
-
58
-
59
-
60
-
61
-
62
-
63
-
64
-
65
-
66
-
67
-
68
-
69
-
70
-
71
-
72
-
73
-
74
-
75
-
76
 |
 |

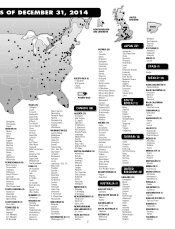
We buy the majority of our merchandise directly from manufacturers and route it to a cross-docking
consolidation point (depot) or directly to our warehouses. Our depots receive container-based shipments
from manufacturers and reallocate these goods for shipment to our individual warehouses, generally in
less than twenty-four hours. This process maximizes freight volume and handling efficiencies, eliminating
many of the costs associated with traditional multiple-step distribution channels. Such traditional steps
include purchasing from distributors as opposed to manufacturers, use of central receiving, storing and
distributing warehouses, and storage of merchandise in locations off the sales floor.
Our average warehouse is approximately 144,000 square feet, however our newer units tend to be
slightly larger. Floor plans are designed for economy and efficiency in the use of selling space, the
handling of merchandise, and the control of inventory. Because shoppers are attracted principally by the
quality of merchandise and the availability of low prices, our warehouses are not elaborate facilities. By
strictly controlling the entrances and exits of our warehouses and using a membership format, we have
limited inventory losses (shrinkage) to amounts well below those of typical discount retail operations.
Marketing activities generally include community outreach programs to local businesses in new and
existing markets and direct mail to prospective new members. Ongoing promotional programs primarily
relate to coupon mailers, The Costco Connection (a magazine we publish for our members), and e-mails
to members promoting selected merchandise.
Our warehouses generally operate on a seven-day, 69-hour week, open weekdays between 10:00 a.m.
and 8:30 p.m., with earlier weekend closing hours. Gasoline operations generally have extended hours.
Because the hours of operation are shorter than other retailers, and due to other efficiencies inherent in a
warehouse-type operation, labor costs are lower relative to the volume of sales. Merchandise is generally
stored on racks above the sales floor and displayed on pallets containing large quantities, thereby
reducing labor required. In general, with variations by country, our warehouses accept cash, checks,
certain debit and credit cards, or a private label Costco credit card.
Our strategy is to provide our members with a broad range of high quality merchandise at prices
consistently lower than they can obtain elsewhere. We seek to limit specific items in each product line to
fast-selling models, sizes, and colors. We carry an average of approximately 3,700 active stock keeping
units (SKUs) per warehouse in our core warehouse business, as opposed to a significantly higher number
of SKUs at other retailers. Many consumable products are offered for sale in case, carton, or multiple-
pack quantities only.
In keeping with our policy of member satisfaction, we generally accept returns of merchandise. On certain
electronic items, we typically have a 90-day return policy and provide, free of charge, technical support
services, as well as an extended warranty. Additional third-party warranty coverage is sold on certain
electronic item purchases.
The following table indicates the approximate percentage of annual net sales accounted for by major
category of items:
2014
2013 2012
Food (including dry and institutionally packaged foods) .......................................................
.
22 % 21% 21%
Sundries (including snack foods, candy, tobacco, alcoholic and nonalcoholic
beverages, and cleaning and institutional supplies) ..........................................................
.
21 % 22% 22%
Hardlines (including major appliances, electronics, health and beauty aids,
hardware, garden and patio, and office supplies)...............................................................
.
16 % 16% 16%
Fresh Food (including meat, produce, deli, and bakery) .....................................................
.
13 % 13% 13%
Softlines (including apparel, small appliances, and home furnishings).............................
.
11 % 11 % 10 %
Ancillary and Other (including gas stations, pharmacy, food court, and optical) ............
.
17 % 17% 18%
9