Costco 2014 Annual Report Download - page 3
Download and view the complete annual report
Please find page 3 of the 2014 Costco annual report below. You can navigate through the pages in the report by either clicking on the pages listed below, or by using the keyword search tool below to find specific information within the annual report.-
 1
1 -
 2
2 -
 3
3 -
 4
4 -
 5
5 -
 6
6 -
 7
7 -
 8
8 -
 9
9 -
 10
10 -
 11
11 -
 12
12 -
 13
13 -
 14
14 -
15
-
16
-
17
-
18
-
19
-
20
-
21
-
22
-
23
-
24
-
25
-
26
-
27
-
28
-
29
-
30
-
31
-
32
-
33
-
34
-
35
-
36
-
37
-
38
-
39
-
40
-
41
-
42
-
43
-
44
-
45
-
46
-
47
-
48
-
49
-
50
-
51
-
52
-
53
-
54
-
55
-
56
-
57
-
58
-
59
-
60
-
61
-
62
-
63
-
64
-
65
-
66
-
67
-
68
-
69
-
70
-
71
-
72
-
73
-
74
-
75
-
76
 |
 |

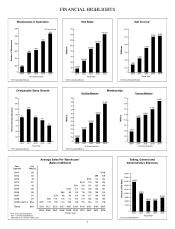
Fiscal Year
$ Millions
2011
0
2,200
1,600
1,800
2,000
1,400
1,200
2012 2013 2014
1,303
2010
1,462
1,709
2,039 2,058
At Fiscal Year End
Number of Warehouses
2011
(671 at 12/31/14)
0
550
575
600
2012 2013 2014
540
2010*
592
608
634
663
625
675
650
Fiscal Year
$ Billions
2011 2012 2013 2014
85
90
95
100
105
2010*
76.255
0
110
115
87.048
97.062
102.870
110.212
80
Fiscal Year
Percent Increase/Decrease
2011 2012
0%
2%
4%
6%
8%
10%
12%
14%
2013 2014
7%
2010*
7%
10%
6%
4%
Fiscal Year
Percent of Net Sales
2010*
0
10.10%
10.20%
10.30%
10.40%
10.50%
9.90%
9.80%
10.00%
20112012 2013 2014
9.70%
9.82%
9.89%
10.29%
9.98%
9.81%
At Fiscal Year End
2011
5.6
5.8
6.0
6.2
6.4
6.6
6.8
7.0
0
2012 20142013
5.800
2010*
Business Members
At Fiscal Year End
Millions
Millions
2011
0
2012 2013 2014
25.000
26.700
28.900
31.600
2010*
Gold Star Members
Membership
28
25
27
26
22.500
6.300
6.400
6.900
6.600
29
23
24
31
32
33
30
FINANCIAL HIGHLIGHTS
Warehouses in Operation
Comparable Sales Growth
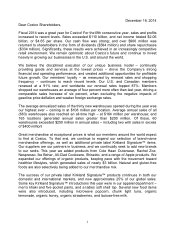
Average Sales Per Warehouse*
(Sales In Millions)
Selling, General and
Administrative Expenses
Membership
Net Sales Net Income*
*2010 excludes Mexico
*2010 excludes Mexico
*First year sales annualized
2011 – 2014 Include Mexico
2006 and 2012 were 53-week years *2010 excludes Mexico
*2010 excludes Mexico
*2010 excludes Mexico *All Years Include Mexico
Year
Opened
# of
Whses
2014 30 $108
2013 26 $99 109
2012 15 $105 115 124
2011 21 $103 120 130 136
2010 13 $94 106 122 135 144
2009 20 $100 107 130 146 155 157
2008 26 $86 83 99 116 128 136 144
2007 31 $76 88 92 103 116 127 136 143
2006 27 $92 101 118 114 122 127 136 145 152
2005 & Before 454 $120 129 135 144 139 148 155 164 172 178
Totals 663 $120 $127 $130 $137 $131 $139 $146 $155 $160 $164
2005 2006 2007 2008 2009 2010 2011 2012 2013 2014
Fiscal Year
1