Costco 2014 Annual Report Download - page 30
Download and view the complete annual report
Please find page 30 of the 2014 Costco annual report below. You can navigate through the pages in the report by either clicking on the pages listed below, or by using the keyword search tool below to find specific information within the annual report.-
 1
1 -
2
-
3
-
4
-
5
-
6
-
7
-
8
-
9
-
10
-
11
-
12
-
13
-
14
-
15
-
16
-
17
-
18
-
19
-
 20
20 -
 21
21 -
 22
22 -
 23
23 -
 24
24 -
 25
25 -
 26
26 -
 27
27 -
 28
28 -
 29
29 -
 30
30 -
 31
31 -
 32
32 -
 33
33 -
 34
34 -
 35
35 -
 36
36 -
 37
37 -
 38
38 -
 39
39 -
 40
40 -
41
-
42
-
43
-
44
-
45
-
46
-
47
-
48
-
49
-
50
-
51
-
52
-
53
-
54
-
55
-
56
-
57
-
58
-
59
-
60
-
61
-
62
-
63
-
64
-
65
-
66
-
67
-
68
-
69
-
70
-
71
-
72
-
73
-
74
-
75
-
76
 |
 |

impact of one additional week of sales in 2012. Changes in foreign currencies relative to the U.S. dollar
negatively impacted net sales by approximately $208, or 21 basis points during 2013. The negative
impact was primarily due to the Japanese yen of approximately $354, partially offset by a positive impact
of the Mexican peso of approximately $127. Changes in gasoline prices were immaterial to the change in
net sales.
Comparable Sales
Comparable sales increased 6% during 2013 and were positively impacted by increases in both shopping
frequency and the average amount spent by our members. Changes in foreign currencies relative to the
U.S. dollar and gasoline prices were immaterial to the change in comparable sales. The increase in
comparable sales includes the negative impact of cannibalization.
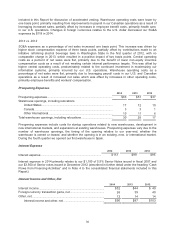
Membership Fees
2014 2013 2012
Membershi
p
fees ................................................................................ $2,428 $2,286
$2,075
Membership fees increase ................................................................ 6 % 10 % 11 %
Membership fees as a percentage of net sales .............................. 2.20 % 2.22 % 2.13%
2014 vs. 2013
Membership fees increased 6% in 2014. This increase was primarily due to membership sign-ups at
existing and new warehouses and increased number of upgrades to our higher-fee Executive
Membership program. The raising of our membership fees in fiscal 2012 positively impacted 2014 by $9.
These increases were partially offset by changes in foreign currencies relative to the U.S. dollar, which
negatively impacted membership fees by approximately $35 in 2014. Our member renewal rates are
currently 91% in the U.S. and Canada and 87% worldwide.
We increased our annual membership fees in the U.S. and Canada effective November 1, 2011, for new
members, and January 1, 2012, for renewal members. We account for membership fee revenue, net of
refunds, on a deferred basis, whereby revenue is recognized ratably over the one-year membership
period.
2013 vs. 2012
Membership fees increased 10% in 2013. The increase was primarily due to raising our annual
membership fees and membership sign-ups at both existing and new warehouses. The fee increase had
a positive impact on membership fee revenues of approximately $119 and $37 in 2013 and 2012,
respectively. These increases were partially offset by the impact of one additional week of membership
fees in 2012.
Gross Margin
2014 2013 2012
Net sales ................................................................................................... $110,212 $102,870
$ 97,062
Less merchandise costs ......................................................................... 98,458 91,948
86,823
Gross mar
g
in ............................................................................................
$
11,754
$
10,922
$
10,239
Gross margin as a percentage of net sales ......................................... 10.66 % 10.62 % 10.55%
2014 vs. 2013
Gross margin as a percentage of net sales increased four basis points. Gross margin in our core
merchandise categories (food and sundries, hardlines, softlines, and fresh foods) when expressed as a
percentage of net sales increased six basis points, primarily due to increases in our softlines and food
and sundries categories, partially offset by a decrease in hardlines. Fresh foods also had a positive
28