Costco 2014 Annual Report Download - page 29
Download and view the complete annual report
Please find page 29 of the 2014 Costco annual report below. You can navigate through the pages in the report by either clicking on the pages listed below, or by using the keyword search tool below to find specific information within the annual report.-
 1
1 -
2
-
3
-
4
-
5
-
6
-
7
-
8
-
9
-
10
-
11
-
12
-
13
-
14
-
15
-
16
-
17
-
18
-
 19
19 -
 20
20 -
 21
21 -
 22
22 -
 23
23 -
 24
24 -
 25
25 -
 26
26 -
 27
27 -
 28
28 -
 29
29 -
 30
30 -
 31
31 -
 32
32 -
 33
33 -
 34
34 -
 35
35 -
 36
36 -
 37
37 -
 38
38 -
 39
39 -
40
-
41
-
42
-
43
-
44
-
45
-
46
-
47
-
48
-
49
-
50
-
51
-
52
-
53
-
54
-
55
-
56
-
57
-
58
-
59
-
60
-
61
-
62
-
63
-
64
-
65
-
66
-
67
-
68
-
69
-
70
-
71
-
72
-
73
-
74
-
75
-
76
 |
 |

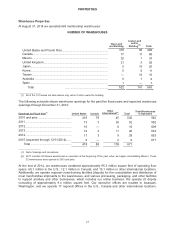
RESULTS OF OPERATIONS
Net Sales
2014 2013 2012
Net Sales ............................................................................................... $110,212 $102,870
$97,062
Increases in net sales:
U.S. ................................................................................................. 7 % 5 % 11 %
International ................................................................................... 8 % 8 % 14%
Total Co mpa ny .............................................................................. 7 % 6 % 12%
Increases in com
p
arable warehouse sales(1):
U.S. ................................................................................................. 5 % 6 % 7%
International ................................................................................... 3 % 6 % 6%
Total Co mpa ny .............................................................................. 4 % 6 % 7%
Increases in comparable warehouse sales excluding the
impact of
g
asoline price and forei
g
n currenc
y
chan
g
es(1):
U.S. ................................................................................................. 5 % 6 % 6%
International ................................................................................... 7 % 6 % 8%
Total Co mpa ny .............................................................................. 6 % 6 % 6%
_______________
(1) For 2013 and 2012, the prior year includes the comparable 52 weeks and 53 weeks, respectively.
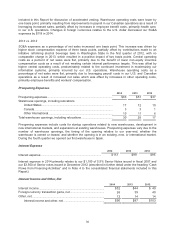
2014 vs. 2013
Net Sales
Net sales increased $7,342 or 7% during 2014. This was attributable to a 4% increase in comparable
warehouse sales, and sales at warehouses opened in 2013 and 2014. Changes in foreign currencies
negatively impacted net sales by approximately $1,336, or 130 basis points, compared to 2013. The
negative impact was primarily due to the Canadian dollar of approximately $1,140 and the Japanese yen
of approximately $311. Changes in gasoline prices negatively impacted net sales by approximately $364,
or 35 basis points, due to a 3% decrease in average sales price per gallon.
Comparable Sales
Comparable sales increased 4% during 2014 and were primarily impacted by an increase in shopping
frequency. Changes in foreign currencies relative to the U.S. dollar and gasoline prices negatively
impacted comparable sales results, including the average amount spent by our members during 2014. In
local currencies, International comparable sales increased 7%; 9% in Canada and 4% in our Other
International segment. The increase in comparable sales also includes the negative impact of
cannibalization (established warehouses losing sales to our newly opened locations), primarily in our
Other International operations.
2013 vs. 2012
Net Sales
Net sales increased $5,808 or 6% during 2013. This increase was attributable to a 6% increase in
comparable warehouse sales and sales at warehouses opened in 2012 and 2013, partially offset by the
27