Costco 2001 Annual Report Download - page 9
Download and view the complete annual report
Please find page 9 of the 2001 Costco annual report below. You can navigate through the pages in the report by either clicking on the pages listed below, or by using the keyword search tool below to find specific information within the annual report.-
 1
1 -
 2
2 -
 3
3 -
 4
4 -
 5
5 -
 6
6 -
 7
7 -
 8
8 -
 9
9 -
 10
10 -
 11
11 -
 12
12 -
 13
13 -
 14
14 -
 15
15 -
 16
16 -
 17
17 -
 18
18 -
 19
19 -
 20
20 -
21
-
22
-
23
-
24
-
25
-
26
-
27
-
28
-
29
-
30
-
31
-
32
-
33
-
34
-
35
-
36
-
37
-
38
-
39
-
40
-
41
-
42
-
43
-
44
 |
 |

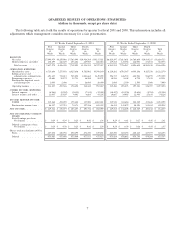
QUARTERLY RESULTS OF OPERATIONS (UNAUDITED)
(dollars in thousands, except per share data)
The following table sets forth the results of operations by quarter for fiscal 2001 and 2000. This information includes all
adjustments which management considers necessary for a fair presentation.
52 Weeks Ended September 2, 2001 53 Weeks Ended September 3, 2000
First Second Third Fourth First Second Third Fourth
Quarter Quarter Quarter Quarter Total Quarter Quarter Quarter Quarter Total
12 12 12 16 52 12 12 12 17 53
Weeks Weeks Weeks Weeks Weeks Weeks Weeks Weeks Weeks Weeks
REVENUE
Net sales . . . . . . . . . . . . . . $7,498,979 $8,159,980 $7,563,494 $10,914,568 $34,137,021 $6,824,197 $7,613,601 $6,768,608 $10,414,317 $31,620,723
Membership fees and other . . . 138,299 146,329 155,401 219,987 660,016 119,315 123,386 126,000 174,872 543,573
Total revenue . . . . . . . . . . 7,637,278 8,306,309 7,718,895 11,134,555 34,797,037 6,943,512 7,736,987 6,894,608 10,589,189 32,164,296
OPERATING EXPENSES
Merchandise costs ......... 6,713,644 7,275,958 6,825,636 9,782,902 30,598,140 6,120,201 6,792,367 6,084,246 9,325,356 28,322,170
Selling, general and
administrative administrative . 691,127 731,411 705,858 1,000,663 3,129,059 596,717 636,739 604,924 916,975 2,755,355
Preopening expenses . . . . . . . 19,680 10,572 12,751 16,568 59,571 10,334 8,108 6,728 17,151 42,321
Provision for impaired assets
and closing costs . . . . . . . . 1,000 1,000 — 16,000 18,000 1,000 1,500 1,500 3,000 7,000
Operating income ......... 211,827 287,368 174,650 318,422 992,267 215,260 298,273 197,210 326,707 1,037,450
OTHER INCOME (EXPENSE)
Interest expense . . . . . . . . . . (6,964) (8,902) (9,023) (7,135) (32,024) (10,397) (10,576) (9,604) (8,704) (39,281)
Interest income and other . . . . 11,005 15,829 9,801 6,603 43,238 10,667 14,983 12,943 15,633 54,226
INCOME BEFORE INCOME
TAXES ............... 215,868 294,295 175,428 317,890 1,003,481 215,530 302,680 200,549 333,636 1,052,395
Provision for income taxes . . . . 86,347 117,718 70,171 127,156 401,392 86,212 121,072 80,220 133,454 420,958
NET INCOME . . . . . . . . . . . . $ 129,521 $ 176,577 $ 105,257 $ 190,734 $ 602,089 $ 129,318 $ 181,608 $ 120,329 $ 200,182 $ 631,437
NET INCOME PER COMMON
SHARE:
Basic Earnings per share:
Net Income ........... $ 0.29 $ 0.39 $ 0.23 $ 0.42 $ 1.34 $ 0.29 $ 0.41 $ 0.27 $ 0.45 $ 1.41
Diluted earnings per share:
Net Income ........... $ 0.28 $ 0.38 $ 0.23 $ 0.41 $ 1.29 $ 0.28 $ 0.39 $ 0.26 $ 0.43 $ 1.35
Shares used in calculation (000’s):
Basic . . . . . . ........... 447,676 448,788 450,195 451,310 449,631 443,300 445,255 448,113 447,757 446,255
Diluted ............... 473,920 475,488 475,840 477,875 475,827 473,414 476,642 478,750 474,304 475,737
7