Costco 2001 Annual Report Download - page 34
Download and view the complete annual report
Please find page 34 of the 2001 Costco annual report below. You can navigate through the pages in the report by either clicking on the pages listed below, or by using the keyword search tool below to find specific information within the annual report.-
 1
1 -
2
-
3
-
4
-
5
-
6
-
7
-
8
-
9
-
10
-
11
-
12
-
13
-
14
-
15
-
16
-
17
-
18
-
19
-
20
-
21
-
22
-
23
-
 24
24 -
 25
25 -
 26
26 -
 27
27 -
 28
28 -
 29
29 -
 30
30 -
 31
31 -
 32
32 -
 33
33 -
 34
34 -
 35
35 -
 36
36 -
 37
37 -
 38
38 -
 39
39 -
 40
40 -
 41
41 -
 42
42 -
 43
43 -
 44
44
 |
 |

COSTCO WHOLESALE CORPORATION
NOTES TO CONSOLIDATED FINANCIAL STATEMENTS (Continued)
(dollars in thousands, except per share data)
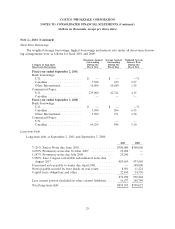
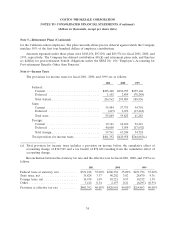
Note 4—Stock Options (Continued)
Costco Wholesale Corporation (collectively the Old Stock Option Plans). Options were granted for a
maximum term of ten years, and were exercisable upon vesting. Options granted under these plans
generally vest ratably over five to nine years. Subsequent to the merger, new grants of options have not
been made under the Old Stock Option Plans. At September 2, 2001, options for approximately 15.5 mil-
lion shares were vested and 3.8 million shares were available for future grants under the plan.
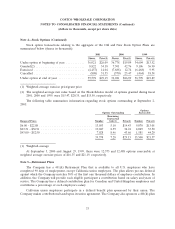
The Company applies Accounting Principles Board Opinion (APB) No. 25 and related interpretations
in accounting for stock options. The Company grants stock options to employees at exercise prices equal to
fair market value on the date of grant, accordingly, no compensation cost has been recognized for the
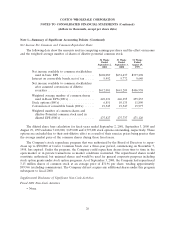
plans. Had compensation cost for the Company’s stock-based compensation plans been determined based
on the fair value at the grant dates for awards under those plans consistent with Statement of Financial
Accounting Standards No. 123 (SFAS No.123), ‘‘Accounting for Stock-Based Compensation,’’ the Com-
pany’s net income and net income per share would have been reduced to the pro forma amounts indicated
below:
2001 2000 1999
Net income:
As reported ........................... $602,089 $631,437 $397,298
Pro forma ............................. $537,012 $570,669 $352,660
Net income per share (diluted):
As reported ........................... $ 1.29 $ 1.35 $ .86
Pro forma ............................. $ 1.15 $ 1.22 $ .77
The effects of applying SFAS No. 123 on pro forma disclosures of net income and earnings per share
for fiscal 2001, 2000, and 1999 are not likely to be representative of the pro forma effects on net income
and earnings per share in future years.
The fair value of each option grant is estimated on the date of grant using the Black-Scholes option-
pricing model with the following weighted average assumptions used for grants in 2001, 2000 and 1999:
2001 2000 1999
Risk free interest rate ......................... 4.96% 6.56% 5.09%
Expected life ................................ 5 years 5 years 7 years
Expected volatility ............................ 43% 42% 37%
Expected dividend yield ........................ 0% 0% 0%
32